Investor discipline: why the result of a strategy is not the same as the result of an investor

In this article, we’ll explore why the same investment strategy can produce completely different results for different investors, how entry timing, drawdowns, and discipline affect long-term performance, and why staying invested often matters more than finding the perfect entry point.
The same strategy can produce different results for different people. The difference does not come from the market, but from behavior: the entry point, the reaction to a drawdown, and the amount of time the investor is ready to stay invested. A strategy can make money for years, while a person using it can still lose money.
Below, we look at a real track record and show how one curve can produce results ranging from +6,689% to -19%. We explain how a drawdown differs from a complete wipeout, why market timing cannot be calculated, and which five questions remove most of the risk before money is invested. This is about investment discipline, not about the quality of management. In these examples, the quality of management is the same.
Why months mislead, while years reveal the truth
At any given moment, the market has dozens of strategies with brilliant results over several months. It has very few strategies with brilliant results over five years. This is not a coincidence and not a sign that things were easier before.
Comparing someone who has traded for five years with someone who has shown excellent numbers for five months is irrelevant. A short track record is likely to end, and then a new one begins from scratch with a new start date. A five-year track record does not have that option. It shows everything, including every stress window and every market cycle the strategy has passed through.
The same thing happens outside the market. A new performer appears and looks like a major rising star: millions of streams, full venues, top positions in the charts. A few years pass, and no one hears about them anymore. At the peak, it is almost impossible to tell who will stay and who will disappear when the trend changes. The difference becomes visible only over time. A strategy works the same way. Sometimes it is simply a hit that perfectly matched the current market fashion.
In sports, a champion is not defined by one victory or one strong season. In music, an artist is not defined by one hit. The quality of a strategy is not defined by a few profitable months or by one perfect-looking section of the chart.
What we look at instead of the shape of the curve: evaluating an investment strategy
The usual evaluation logic is simple: look at the process, make sure it feels comfortable, and stop there. Neither the length of the track record nor the risk embedded in the result is properly assessed.
Our approach is the opposite. We look at a history of several years, where the process may be uncomfortable. There are months that we close in the red, and there are periods when the curve moves down. Over a short segment, this looks worse than a strategy with smooth growth. But these are exactly the periods we pass through instead of falling out of the market. Over time, they become almost invisible on the chart.
In practice, risk management in investments means three things, and risk control is set before the trade, not after the fact.
- Position size is limited so that the worst-case scenario remains a drawdown, not a wipeout. This is basic risk management in trading, and it is defined before the trade, not during it.
- We measure not only return, but also the recovery time after a drawdown. Return and risk must be evaluated together. The risk-return ratio is incomplete without the second part.
- We show how the strategy behaved on each of the sharp market crash days, including those when the result went negative.
Here is how it looks in numbers. In the history of Basket 50, one third of individual months, or 32%, closed in negative territory. At the same time, from 2019 to 2025, there was not a single losing year and not a single losing three-year window. This is the difference between an uncomfortable process and a long-term result. This is why a long-term investment strategy exists.
What is a drawdown and how it differs from a wipeout
There is an important clarification without which everything said above could turn into an excuse for any loss. Not every drawdown can be explained by a long-term approach. If a strategy moves beyond its defined risk parameters, if its logic changes, or if actual results no longer match the model, this is a reason for a separate review, not a reason to be patient.
But if the decline remains within scenarios that were defined in advance, it is not a surprise. It is part of the path, and the possibility of such a period was known before trading began.
A drawdown and a wipeout are not different degrees of the same thing. A drawdown is reversible: the account continues to operate and can recover. The difference is mathematical.
| Drawdown depth | Growth required to recover |
|---|---|
| 10% | 11.1% |
| 20% | 25% |
| 30% | 42.9% |
| 50% | 100% |
The curve becomes steeper quickly, but it remains finite. A wipeout is irreversible. After it, there is no account left to recover. There is only a new track record with a new start date. That is why maximum drawdown is a key evaluation parameter, not a small-print line.
One strategy, different investor experiences: where investor mistakes appear
Even a correctly chosen strategy does not guarantee the same result for every person. A typical sequence looks like this: capital is increased after several months of growth, when it seems that risk has fallen; then a normal drawdown appears on the larger amount; the investor reduces the allocation or disconnects at the bottom; they do not participate in the recovery and return only after the strategy reaches new highs. This is investor psychology in its pure form, and it consistently works against the holder.
The easiest way to see this is through three people in the same strategy. Let us take our own Basket 50 track record: seven years, from August 2019, with a maximum drawdown of -23.6% over the entire period. Over this time, the strategy grew 68 times.
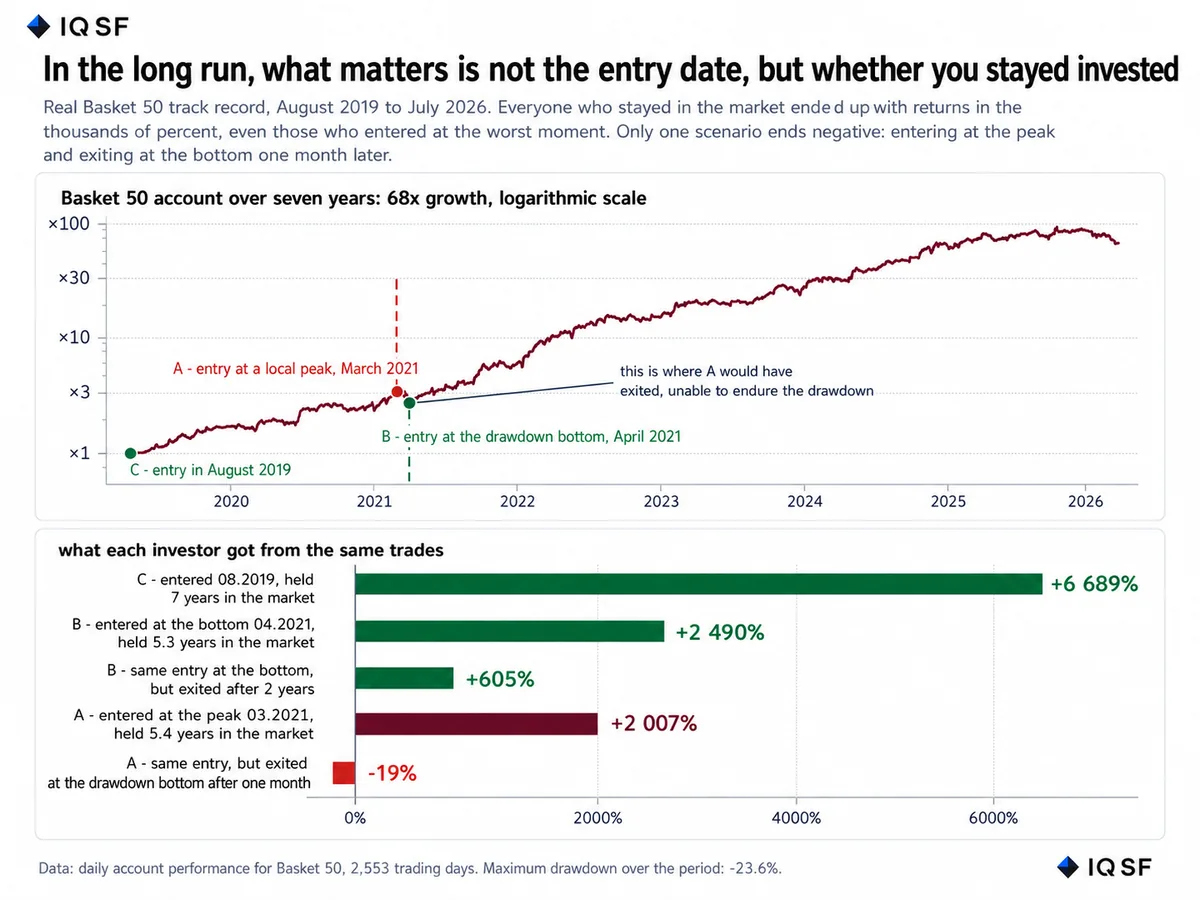
Chart 11. Real Basket 50 track record from August 2019 to July 2026, logarithmic scale. The upward dashed line shows A entering at a local peak in March 2021. The downward dashed line shows B entering at the bottom of the drawdown in April. C entered at the very beginning and held: +6,689%. B held: +2,490%, while someone who exited after two years received +605%. A held: +2,007%, while someone who exited at the bottom of the drawdown received -19%.
First, the longer the investment horizon, the less the entry date matters. C, B, and A had different entry points and different time in the market, yet all three results are measured in thousands of percent. There is a difference between them, but it does not change the order of magnitude. Even an incomplete period from the bottom, only two years, gives +605%. This is not only the effect of a seven-year horizon. This is how compound interest in investments works, and time in the market matters more than the entry moment.
Second, market timing cannot be calculated. A and B are separated by one month. A entered at a local peak on March 9, 2021. B entered at the bottom on April 11. Five years later, the difference between them was 483 percentage points. But those 483 points were not a reward for patience: on March 9, no one knew it was a peak, and on April 11, no one knew it was the bottom. You can wait for a drawdown for six months while the strategy keeps making new highs without you.
The practical conclusion is different. If there is an opportunity to increase the allocation during a drawdown, it can work in your favor. And this can be measured. Take the same A, who entered at the peak: over five years, the capital grew by 2,007%. If in April, at the bottom of the drawdown, A had added the same amount again, the return on the total invested capital would have been 2,248%, or 241 percentage points higher.
This is the mathematical advantage, and it is not a figure of speech. In a strategy with positive mathematical expectation, every invested ruble has positive expected return, while a ruble invested at a price 18.6% lower has an even higher expected return. There is one important condition: the advantage exists only as long as the strategy remains within its parameters. A drawdown inside historical boundaries is the price of the method, and increasing capital during it can be justified. Moving beyond those boundaries is a different discussion, which we addressed above.
It is important to stress one more point: there is no need to specifically accumulate cash and keep it aside for this. Waiting for a drawdown can take six months, and during that time the reserved money does not work. The point is only what to do if the opportunity to increase the allocation appears. A drawdown is not a signal to leave. It is a moment when the entry is objectively cheaper. Capital management here comes down to a simple rule: do not keep dry powder for a forecast that may never happen, but use the drawdown if free capital is available.
Third, and most importantly, A entered at the worst possible moment and still has +2,007%. Entering at the highs says nothing about the strategy itself. It says something else: during the first five weeks, A saw a loss of up to 19%. If A had exited then, that loss would have stayed forever, while the curve would have continued to grow without them. The difference between +2,007% and -19% is not the difference in the strategy and not the difference in the entry date. It is the difference in discipline.
As a result, the strategy has a positive long-term result, while the specific investor has a negative one. In practice, that investor repeatedly buys their own strategy at a higher price and sells it at a lower one. Here, the psychology of money matters more than any analysis: the difference in experience between two clients using the same strategy almost always comes down to the entry date, which they do not choose, and discipline, which they do choose. The quality of management has nothing to do with it.
What resilience means and why the investment horizon starts from three years
Resilience means that one strategy lives and earns money for many years, passing through different periods. It does not mean having a dozen impressive track records over ten years, each with a short history and a new start date.
There are always many short successful tracks. They appear every month. But they do not pass a stress test. That is why comparing a strategy with a three-year track record and a strategy with a three-month track record is irrelevant. The three-month track is likely to end, and then a new one begins from scratch with a new start date. The three-year track already includes the stress windows that separate a resilient system from a temporary coincidence.
That is why we work with a horizon of at least three years and discuss in advance not only returns, but also drawdowns and recovery times. Three years is the minimum period within which there is almost certainly at least one sharp market crash day. Before that, any numbers are not yet a result. They are only a process. Long-term investments here are not a slogan, but a technical requirement: on a shorter horizon, market volatility overwhelms the useful signal, and it is impossible to evaluate the system.
A separate point about algorithmic trading. Decisions are made by an algorithm according to formalized rules, without manual intervention, and this removes part of the behavioral errors on the manager’s side. But it removes nothing on the investor’s side: the decision to add capital, reduce capital, or exit is still made by a human. This is exactly where the results shown above begin to diverge.
Five questions that remove most of the risk
Everything described above comes down to a short check. It does not require access to someone else’s trading and takes only a few minutes. These questions make sense for any strategy, including ours, and they work equally well for a private individual and for a qualified investor evaluating a manager.
- What is the longest continuous track record of one strategy? Not a sum of achievements and not “ten years in the market”, but one strategy with one start date.
- What happened to the strategy on specific dates: March 12, 2020; May 19, 2021; November 9, 2022; October 10, 2025; February 5, 2026? If the track record does not cover them, the stress test has not yet happened.
- What is the win rate? If it is above 90%, where are the losses? Asking to see open positions, not only closed trades, answers this question immediately.
- What was the maximum drawdown, and how long did recovery take? No answer is also an answer: there has not been a drawdown yet, which means there is no data on behavior during it.
- What will be considered a model violation, and what happens then? A strategy without this answer has no distinction between a planned drawdown and “something is going wrong”.
Conclusion
It makes sense to ask us the same five questions. We have the answers in numbers: the length of the continuous track record of one strategy, behavior on each of the listed days, maximum drawdown and recovery time, and the share of losing months and years. This is a conversation we are ready for, and it is the only way to distinguish a statement from a promise.
A practical step before making a decision: write down the drawdown level at which you would exit, and compare that number with the historical drawdown of the strategy. If your number is lower, you will exit, and the result of the strategy will have nothing to do with your result.
We write in detail about behavior during drawdowns in our channel: t.me/IQSF_Alpha. There are monthly reviews there, including the months we closed in negative territory and what we did during those periods.
This is not individual investment advice. Basket 50 track record data: August 2019 to July 2026. Past performance does not guarantee future returns.
Frequently asked questions
Why can the same strategy produce different results for different investors?
The difference comes from investor behavior, not the strategy itself: the entry point, the reaction to a drawdown, and how long the investor stays invested. In one real track record, an investor who entered at a local peak and held through the drawdown ended deeply positive, while someone who exited at the bottom of that same drawdown was left with a loss. The strategy was identical; only discipline differed. Past performance does not guarantee future returns.
What is the difference between a drawdown and a full wipeout?
A drawdown is reversible, since the account keeps operating and can recover, while a wipeout is irreversible and leaves no account left to recover at all. The relationship between the two is mathematical: a 10% drawdown needs a 11.1% gain to recover, a 30% drawdown needs 42.9%, and a 50% drawdown needs 100%. As long as a decline stays within parameters defined in advance, it counts as a drawdown rather than a warning sign.
How long should a strategy's track record be before you trust it?
A track record needs at least three years, since that is roughly the minimum period in which a sharp market crash day is almost certain to occur. Short successful tracks appear every month but rarely pass a stress test, so comparing a three-year track with a three-month one is not meaningful. Before three years of history, the numbers reflect a process rather than a proven result.
What questions should you ask a manager before investing?
Useful questions include the longest continuous track record of a single strategy, what happened to it on specific stress dates, its win rate and where losses come from if that rate is above 90%, and its maximum drawdown along with recovery time. It also helps to ask what would count as a model violation. These questions take only a few minutes and reveal more than the shape of a return curve.