How to reliably underperform the market: a proven guide

In this article, we’ll explore why investors often underperform the market, how fear, FOMO, timing mistakes, and overtrading create the behavior gap, and why a disciplined system can matter more than constant activity.
The investor who slept through twenty years
Imagine a person who bought a broad stock index in the early 2000s and then disappeared. Not for a vacation. For twenty years.
No smartphone with quotes. No news feeds. No evening thoughts like, “What happened to the market today?”
He slept through two financial crises, the bursting of the housing bubble, the 2020 crash, and dozens of headlines about “the collapse everyone had been waiting for.”
Each of those moments gave investors a reason to do something: sell, wait it out, re-enter when things became clearer. He did nothing because he could not. And when he came back, he found a portfolio that had quietly outperformed the average active neighbor who had been trading through all those years.
This is a thought experiment, but it has a real background. There is a well-known story in the investment industry about a large fund that once reviewed its accounts and found something strange: the best returns belonged to clients who had simply forgotten about their accounts. Some had changed addresses and lost contact. Some had died, and their heirs had not touched the assets for years.
There is no documented proof of this story, and we present it exactly as a market anecdote. But it has survived for a reason: very often, what prevents an investor from making money is not the market, but the investor himself.
And if doing nothing so consistently beats excessive activity, a funny thought appears. What if someone wanted to achieve the opposite result? What if a person set a goal to reliably underperform the market? Is there a precise instruction manual for that?
It turns out there is. It is well known, repeatedly tested in practice, and works consistently. Below is the honest version, step by step.
Anti-guide: five ways to destroy your advantage
The advantage of a long-term investor has been measured. Dalbar, a research company, has been tracking one simple thing since 1985: the return of the market on one side, and the return actually earned by the average investor on the other. The difference is called the behavior gap.
In 2024, the S&P 500 returned 25.02%, while the average equity investor earned 16.54%. The gap was 848 basis points, or roughly 8.5 percentage points of return that was available, but the investor failed to capture.
That is exactly the gap you need to create with your own hands. Follow the advice below.
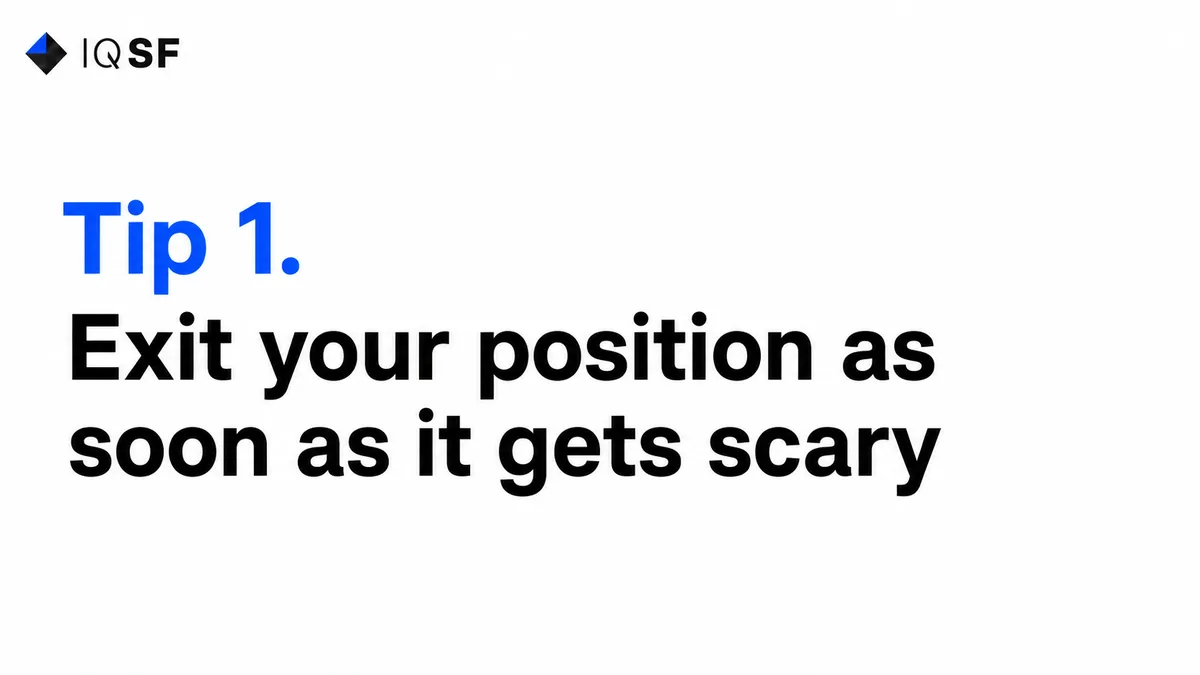
The logic is simple: the market turns red, the account hurts, so you should immediately sell everything and sit in cash until better times. Why stay invested during a decline if you can step aside and return when things become clearer?
Why this works perfectly against you.
Long-term market returns do not accumulate evenly. A huge part of total growth comes from a tiny number of the best days. And those best days almost always sit very close to the worst days, right near the moments of panic when the desire to sell is strongest.
A simple numerical image: take twenty years, which is roughly five thousand trading days. Suppose an investor who stayed in the market the whole time doubled his capital. Now imagine he got scared a couple of times and missed only the ten best days out of those five thousand.
Not one hundred. Not one thousand. Just ten.
Historical data for the U.S. market shows that such an investor can finish with roughly half the result of someone who simply stayed invested. Ten days out of five thousand can determine half the outcome.
So yes, selling out of fear is a reliable method. Reliable in the wrong direction.
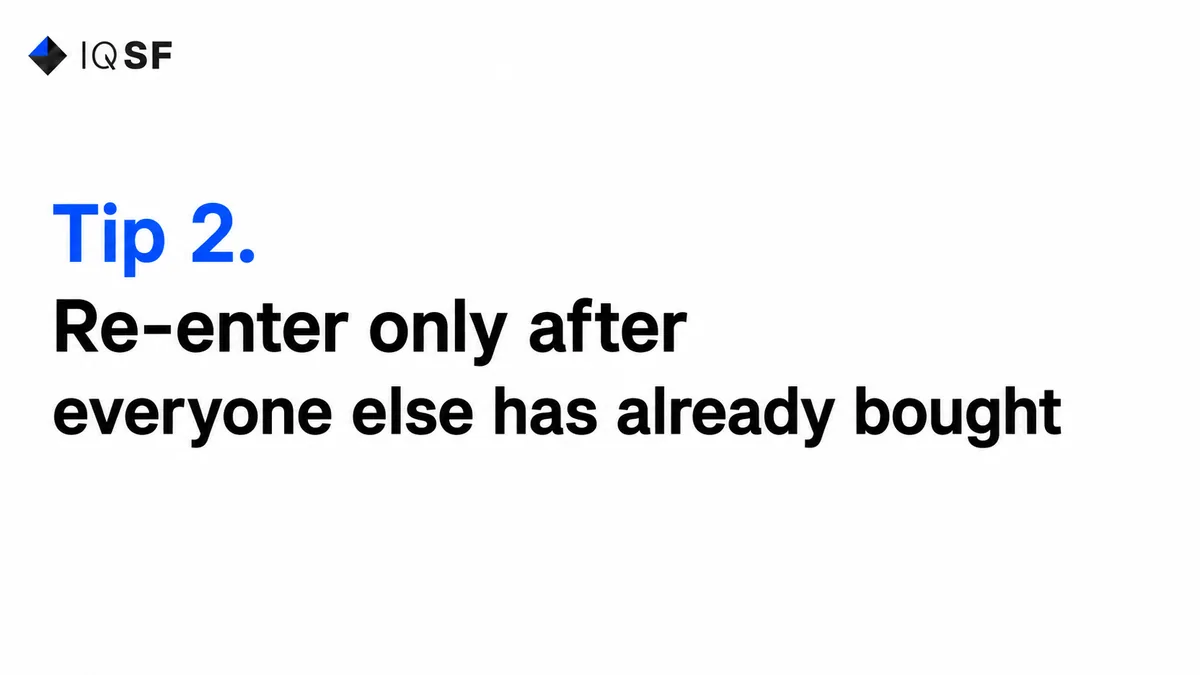
Once you are out, the main thing is not to rush back. Wait until the market has already grown confidently, the news has calmed down, and your friends start bragging about returns again. That is when it feels safe to invest again.
Why this is brilliantly harmful.
For a person to trust the market again, he needs to see that it has already recovered. In other words, he systematically sells closer to the bottom and buys closer to the top. This is the exact opposite of what needs to be done.
This is where the arithmetic of timing hides: for market timing to work, you need to be right twice. First, when to exit. Second, when to enter again. A mistake at either point means you miss exactly the best days that made the whole exercise matter.
Advice 1 and Advice 2 together almost guarantee that you will be out of the market exactly when it rises, and in the market exactly when it does nothing. Perfect for underperformance.
Did the strategy have a weak month? Obviously, it no longer works. Drop it and move into whatever has recently gone up. Repeat the process next month. This way, you will always be in the best thing available right now.
Why this leads nowhere.
A short period of time is mostly variance, random dispersion, not a signal about the quality of a strategy. A month or a quarter is too short to judge anything meaningful. You react to noise and mistake it for information.
In practice, this becomes a chase after what has already risen. It is the same buying near the top from Advice 2, just more often.
Every switch is a timing bet, and every switch brings costs. At the same time, you deprive compound interest of the chance to work. It needs years of continuity, while you reset the clock every month.
A worrying headline, a report, an official’s tweet, an analyst forecast. All of it requires an immediate trade. A real investor keeps his finger on the pulse and reacts to every event. The more activity, the more serious the approach.
Why this is expensive in the most literal sense.
Most news is noise that will be forgotten by tomorrow. But reacting to it costs real money. Every unnecessary move means a commission to the broker and a spread. Every realized gain outside tax-advantaged structures means a tax paid earlier than necessary, which reduces the base on which compound growth could have worked.
Each individual cost may look small. Over twenty years, frequent trading eats a noticeable part of the result even before the behavior gap is considered.
Add to this the fact that activity for the sake of activity usually worsens decision quality, and you get a double tax: one paid in money, and another paid in mistakes. An excellent way to underperform without noticing how it happened.

Why have a written plan in advance if you have intuition? In the moment, things are clearer. You feel anxious, you sell. You feel excited, you buy more. Listen to yourself. After all, the market is a living organism.
Why your feelings will fail you exactly when it matters most.
The investor’s brain is wired so that the pain of a loss feels roughly twice as strong as the pleasure from an equal-sized gain. When the account turns red, selling immediately stops the pain. That is a powerful incentive pushing you to act at exactly the wrong moment.
On top of that, there are two traps.
The first is FOMO, the fear of missing out. A neighbor brags about doubling his money in a popular asset, and sitting in a boring index suddenly becomes unbearable.
The second is the illusion of control. It feels like making frequent decisions means you are in control, although frequent decisions usually add more errors than they remove.
So “trust your feelings” is not freedom. It is a reliable way to buy near the top and sell near the bottom.
Willpower in a panic almost always loses. A rule written with a calm mind wins more often. That is exactly why Advice 5 is so effective for anyone trying to lose.
What this adds up to
Put all five pieces of advice together, and you get the portrait of the average investor, repeated almost unchanged from decade to decade.
The same 8.5 percentage point gap in 2024 was not just one bad year. Over the twenty years ending in 2024, the average investor earned 9.24% per year, while the index delivered 10.35% over the same period.
A difference of just over one percentage point per year may sound trivial. But because of compounding, over twenty years it turns into a portfolio roughly 22% smaller than the one held by an investor who simply bought the index and left it alone.
Twenty-two percent of capital. Not because of a crisis. Not because of a bad asset. Simply because of behavior following the instruction manual above.
And this is not unique to one methodology. A separate Morningstar study called Mind the Gap shows the same pattern over a ten-year horizon: the average fund delivered about 7.3% per year, while the average investor in that same fund earned about 6.3%.
Because of poorly timed entries and exits, people lose roughly 15% of the total return of their own fund. The same fund, the same strategy, yet the investor manages to capture one-sixth less than the strategy actually delivered.
As you can see, the anti-guide works on any dataset.
Short conclusion
To reverse the instruction, you only need to read it backward.
Do not sell out of fear. Do not return only in euphoria. Do not change course because of one noisy month. Do not trade every headline. Trust a rule written in advance more than a feeling in the moment.
It sounds boring, and that is the whole point: fewer actions, more rules.
The investor’s main opponent is not the market and not a crisis. It is the temptation to urgently do something at the exact moment when doing nothing is most valuable.
The behavior gap is the only expense category that an investor fully controls himself. Not through prediction, but through a system and the patience that comes from it.
Glossary
Behavior gap is the difference between the return of the market or a fund and the return actually earned by the average investor. It appears because people enter and exit at the wrong times.
Compound interest is the effect where returns begin to generate returns. Profit is not withdrawn, but remains invested, and over time it grows on itself. That is why a small difference in annual return can become a large difference in capital after twenty years.
Variance is a measure of random dispersion around the average. Over a short period of time, returns are mostly made up of this dispersion, which is why a month or a quarter is not enough to judge the quality of a strategy.
Spread is the difference between the buying price and the selling price of an asset at the same moment. It is a hidden cost that an investor pays on every trade in addition to commission.
FOMO means fear of missing out. It is the desire to urgently buy what has already gone up for other people, in order not to be left behind. It is a common reason for buying near the top.
Frequently asked questions
What is the behavior gap in investing?
The behavior gap is the difference between the return a market or fund actually delivers and the return the average investor actually earns, caused by entering and exiting at the wrong times. In 2024 the S&P 500 returned 25.02 percent while the average equity investor earned 16.54 percent, a gap of about 8.5 percentage points. Over the twenty years ending in 2024 the average investor earned 9.24 percent a year against 10.35 percent for the index.
Why does missing just a few of the market's best days hurt returns so much?
Long-term market gains do not build up evenly, and most of the total growth comes from a small number of best days that tend to sit close to the worst days, near moments of panic. An investor who stayed fully invested over about five thousand trading days but missed only the ten best of them can finish with roughly half the result of someone who never stepped out.
Why does trying to time the market by selling in fear and buying back later hurt returns?
Market timing requires being right twice: when to exit and when to re enter, and a mistake at either point means missing exactly the best days that mattered. People tend to sell only once fear takes hold, near the bottom, and feel safe buying back only after the market has recovered, near the top, the opposite of what works. Switching strategy after one weak month adds the same effect.
How much can the behavior gap cost an investor over the long run?
Over twenty years a roughly one percentage point annual gap between the index and the average investor compounds into a portfolio about 22 percent smaller than simply buying and holding. A separate Morningstar study over ten years found a similar pattern: the average fund returned about 7.3 percent a year while the average investor in it earned about 6.3 percent, roughly 15 percent less.