What is a drawdown? Maximum drawdown explained for investors
In this article, we explore what drawdown is, why it is one of the key indicators of strategy risk, how to properly evaluate maximum drawdown and recovery duration, and why professional investors focus on capital stability rather than returns alone.
In the investment environment, the term drawdown is used constantly. However, many investors interpret it in a simplified way — as a temporary negative balance in an account.
In reality, drawdown is one of the key indicators of a strategy’s risk. It determines how resilient a capital management model truly is.
What is drawdown in simple terms
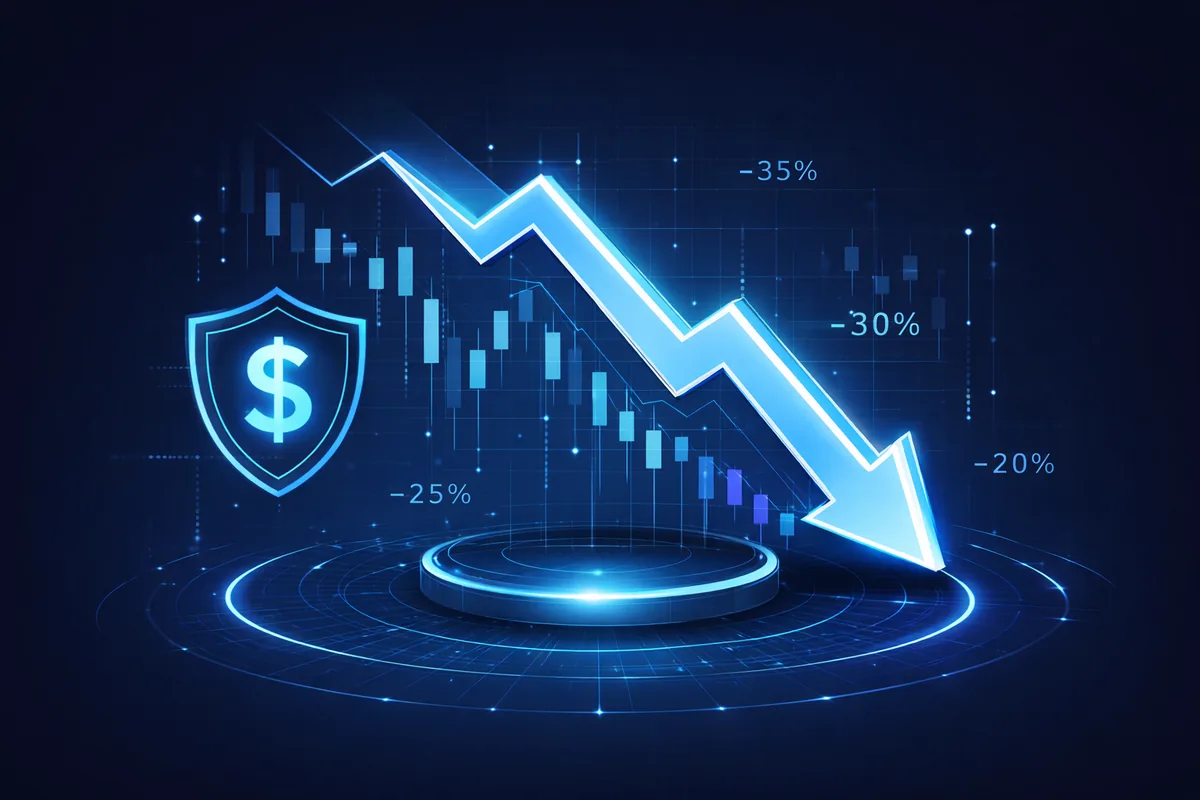
A drawdown is the decline in the value of a portfolio from a previous peak to a local minimum.
If a strategy reaches a peak of +30% and then declines to +10%, capital falls from 130 to 110, so the actual drawdown is about 15.4%, not 20%.
It is important to understand that:
Drawdown is measured not from the initial capital, but from the most recent peak of the equity curve.
Maximum drawdown
Maximum drawdown is the largest decline in capital over the analyzed period.
This metric helps investors answer a fundamental question:
What level of capital decline has the strategy already experienced in the past?
Maximum drawdown reflects:
- the depth of risk
- the stress load on capital
- the investor’s psychological resilience
- the potential volatility of results
The higher the return without proper risk control, the higher the probability of a deep drawdown.
Why drawdown is more important than monthly returns
High returns can result from:
- excessive leverage
- concentrated positions
- ignoring risk limits
- temporarily favorable market conditions
However, drawdown shows the price paid for those returns.
A strategy with 40% return and 35% drawdown is fundamentally different from a strategy with 25% return and 15% drawdown.
In the second case, capital stability is higher and the probability of recovery after an unfavorable phase is significantly greater.
Depth and duration of drawdowns
It is important to evaluate not only the percentage decline, but also the time required for recovery.
Two parameters are critical:
Depth — how much the capital declined
Duration — how long it took to return to the previous peak
Long drawdowns create:
- psychological pressure on the investor
- risk of premature withdrawal
- reduced confidence in the strategy
A professional approach takes both factors into account.
Why the absence of drawdowns is a warning sign
If a strategy shows:
- an almost perfectly smooth return curve
- minimal or no drawdowns
- stable results regardless of market conditions
this is a reason to ask questions.
Often, an “ideal” equity curve may hide:
- shifting losses into the future
- averaging against the market
- hidden concentration of risk
Real risk does not disappear — it is simply postponed.
Drawdown and risk management
In institutional capital management, drawdown is viewed as a controllable parameter.
Control is achieved through:
- limiting risk per trade
- managing total exposure
- adapting to changing market regimes
- reducing activity during unfavorable phases
The goal is not to eliminate drawdowns completely.
The goal is to make them predictable and controlled.
The IQ Security Fund approach
At IQ Security Fund, drawdown management is embedded in the architecture of the strategy.
Each trade has a predefined level of risk.
Exposure is limited.
Trading activity is adjusted depending on market structure.
Drawdowns are viewed not as an exception, but as a natural element of result distribution within a probabilistic model.
The quality of a strategy is determined not by the absence of drawdowns, but by whether:
- they remain within historical parameters
- the expected value of the strategy is preserved
- the scale of risk is controlled
Conclusion
Drawdown is not just a temporary loss.
It is the main indicator of the level of risk embedded in a strategy.
Evaluating a strategy only by its returns is a methodological mistake.
A comprehensive analysis should include:
- maximum drawdown
- recovery duration
- return volatility
- resilience across different market regimes
Such a systematic approach allows investors to distinguish short-term luck from a sustainable capital management model.
Frequently asked questions
What does drawdown mean in simple terms?
A drawdown is the decline in a portfolio's value from its previous peak down to a local low point, measured from the most recent peak rather than the original capital invested. For example, if a strategy reaches a peak of +30% and then falls back to +10%, capital falls from 130 to 110, a drawdown of about 15.4%. Maximum drawdown refers to the single largest such decline over the period being analyzed.
Why does drawdown matter more than monthly returns?
Drawdown matters more because high returns can come from excessive leverage, concentrated positions, ignored risk limits, or simply favorable conditions, while drawdown shows the price paid for those returns. A strategy with a 40% return and a 35% drawdown differs fundamentally from one with a 25% return and a 15% drawdown, since the second has greater capital stability. Evaluating a strategy by returns alone is a methodological mistake.
Why is an unusually smooth equity curve a warning sign?
A near-perfectly smooth curve with minimal or no drawdowns raises questions, because real risk in a strategy does not disappear, it is simply postponed. Such a curve can hide losses being pushed into the future, averaging against the market, or a hidden concentration of risk. The goal of a sound strategy is not to eliminate drawdowns completely but to keep them predictable and controlled.
How is drawdown controlled at the strategy level?
Drawdown is controlled by limiting risk per trade, managing total exposure, adapting to market regimes, and reducing activity during unfavorable phases. At IQ Security Fund, each trade has a predefined risk level, exposure is limited, and activity adjusts to market structure, treating drawdowns as a natural part of a probabilistic model rather than an exception. Quality is judged by whether drawdowns stay within historical parameters.