How to distinguish real trading statistics from “marketing” data

Learn how to distinguish real trading statistics from marketing data. What investors should look at: PnL, drawdowns, and data transparency.
Why investors often don’t see the real picture
In the investment market, almost any strategy can appear attractive.
Beautiful charts.
Steady growth.
High returns.
But the problem is:
- showing good results is easy
- showing real results is much harder
The difference between these two approaches defines the boundary between marketing and reality.
Key principle: full history vs. selective data
The first thing to pay attention to:
Is the full performance history being shown?
Marketing statistics typically:
- highlight selected periods
- exclude losing phases
- focus only on growth
Real statistics always:
- are continuous
- include all periods
- are not edited retroactively
If you only see “best months,” that’s not statistics — it’s a presentation.
Sign № 1: Unrealistically smooth returns
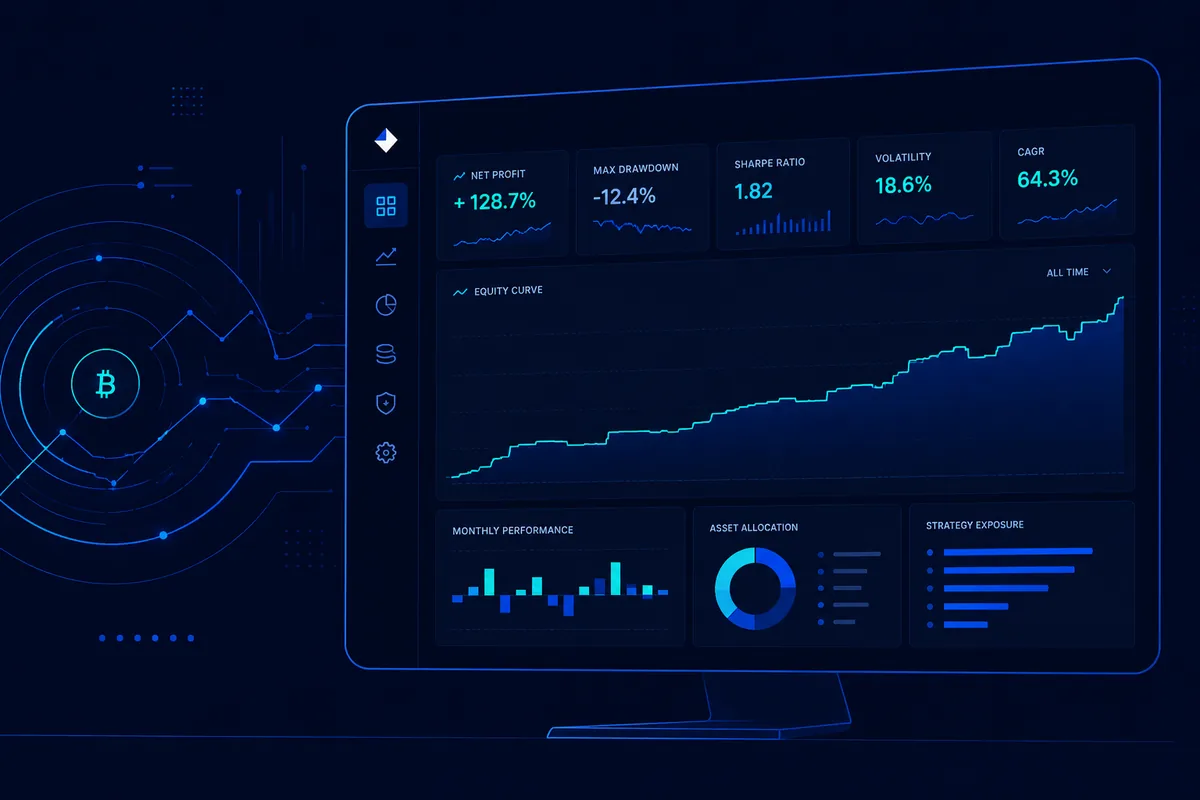
A perfectly smooth equity curve is one of the most common warning signs.
Real strategies always include:
- fluctuations
- periods of stagnation
- losing streaks
If these are absent, the key question is:
How is such stability achieved?
Often, it may involve:
- loss deferral
- not realizing losses
- hidden risks
Sign № 2: No drawdowns
Any strategy with positive expected value inevitably goes through drawdowns.
If a strategy shows:
- minimal or no drawdowns
- steady growth without deviations
this is more likely a sign of distorted data or hidden risk, not stability.
Sign № 3: No Daily PnL
One of the most important elements is daily trading statistics (Daily PnL).
Without it, it is impossible to:
- understand the structure of returns
- assess volatility
- identify real drawdowns
- evaluate strategy behavior
Monthly or yearly reports often hide critical details.
Sign № 4: Focus only on returns
If a strategy communication includes only:
- profit percentages
- final results
but no information about:
- risk
- drawdowns
- volatility
this is a clear sign of a marketing-driven approach.
Professional market participants always talk about risk first.
Sign № 5: Lack of strategy logic
Even without revealing full details, a strategy should clearly explain:
- its core logic
- operating conditions
- behavior in different market phases
If the explanation boils down to:
“we just make money” — that’s not an investment model, it’s a black box.
Why this matters for investors
Marketing statistics are dangerous not because they are “false,” but because they:
- distort risk perception
- create unrealistic expectations
- lead to poor decisions
As a result, the investor evaluates not the strategy itself, but a simplified version of it.
IQ Security Fund approach
At IQ Security Fund, transparency is a core principle.
This means:
- continuous daily PnL history
- no selective reporting
- focus not only on returns, but also on risk
- analysis of profit and loss structure
We believe that:
an investor should see not the “best moments,” but the full picture of strategy behavior.
How investors should evaluate a strategy
Before investing, ask yourself:
- Is there continuous performance data?
- Are drawdowns and losing periods visible?
- Is the strategy logic clear?
- Is risk data available?
If even one of these is missing, it’s a reason for deeper analysis.
Conclusion
Distinguishing real statistics from marketing is not about experience — it’s about approach.
A real strategy:
- shows the full history
- does not hide drawdowns
- reveals the risk structure
- looks less “perfect,” but is more reliable
A marketing-driven one does the opposite.
And in the long run, this difference is what determines an investor’s outcome.
Frequently asked questions
How can you tell if a fund's trading statistics are real or just marketing?
Real statistics show a continuous history that includes every period, both winning and losing, without retroactive edits. If you only see selected best months or a highlight reel of results, that is a presentation rather than statistics. The full picture, not the flattering excerpt, is what separates marketing data from a genuine track record.
Why is a perfectly smooth equity curve with no drawdowns a warning sign?
Any strategy with a positive expected return inevitably goes through drawdowns, fluctuations and periods of stagnation. A curve that shows none of these is more likely explained by deferred or unrealized losses and hidden risk than by genuine stability. Minimal or absent drawdowns should raise questions rather than confidence.
Why does daily PnL matter more than monthly or yearly performance reports?
Daily PnL is what makes it possible to understand the structure of returns, assess volatility and identify real drawdowns in a strategy. Monthly or yearly reports often hide these critical details by smoothing the picture over a longer period. Without continuous daily data, a strategy's behavior cannot be properly evaluated.
What questions should an investor ask before trusting a strategy's statistics?
Four questions matter: is continuous performance data shown, are drawdowns and losing periods visible, is the strategy's logic clearly explained, and is risk data available alongside returns. If even one of these is missing, that is a reason for deeper analysis before investing. A strategy explained only as we just make money, with no mention of risk, is a black box rather than an investment model.