IQ Metrics: Stop trusting screenshots. Verify any trading strategy with real exchange data
In this article, we’ll explore why screenshots are no longer enough to prove a trading strategy, how IQ Metrics verifies performance directly through exchange API data, and why transparent metrics help investors, traders, funds, and exchanges make decisions based on real numbers rather than promises.
Check your strategy for free in 1 minute iq-metrics.pro. (Metrics from the exchange API. Read-only mode. No risk to your funds).
In crypto and trading, trust is often built on screenshots. A trader shows a chart with huge returns, a strategy looks like a rocket, and copy trading promises mountains of gold. But verifying it is almost impossible: a beautiful picture can be created in five minutes, while the real trading history stays hidden behind the scenes. This is exactly where money gets lost: in the gap between “shown” and “proven”.
IQ Metrics closes that gap. It is a verified analytics service for trading strategies. Metrics are collected directly from the exchange API in real time, which means the numbers cannot simply be drawn manually. Transparent. Auditable. Verifiable. Let us get straight to the point: what IQ Metrics is, who it is useful for, what exactly it highlights, and how to use it.
What IQ Metrics is in simple terms
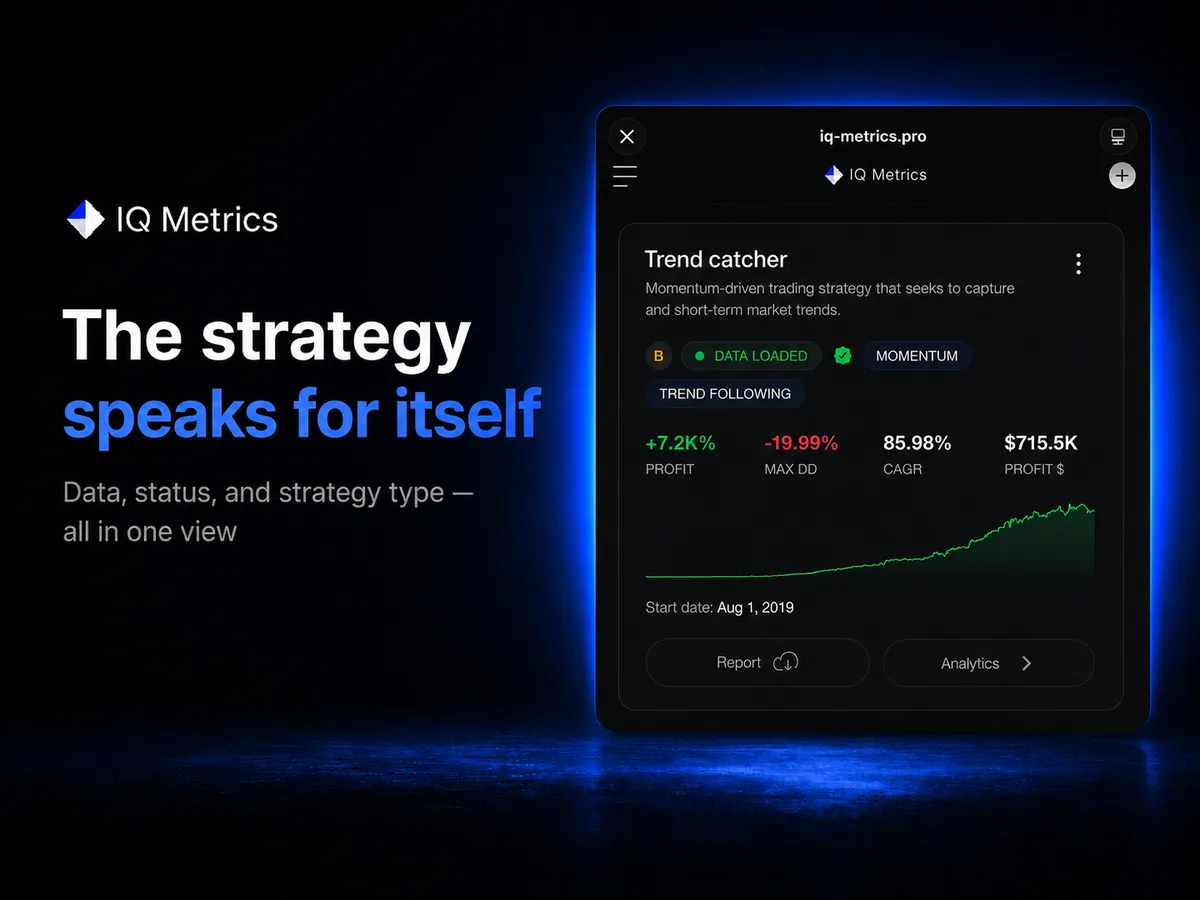
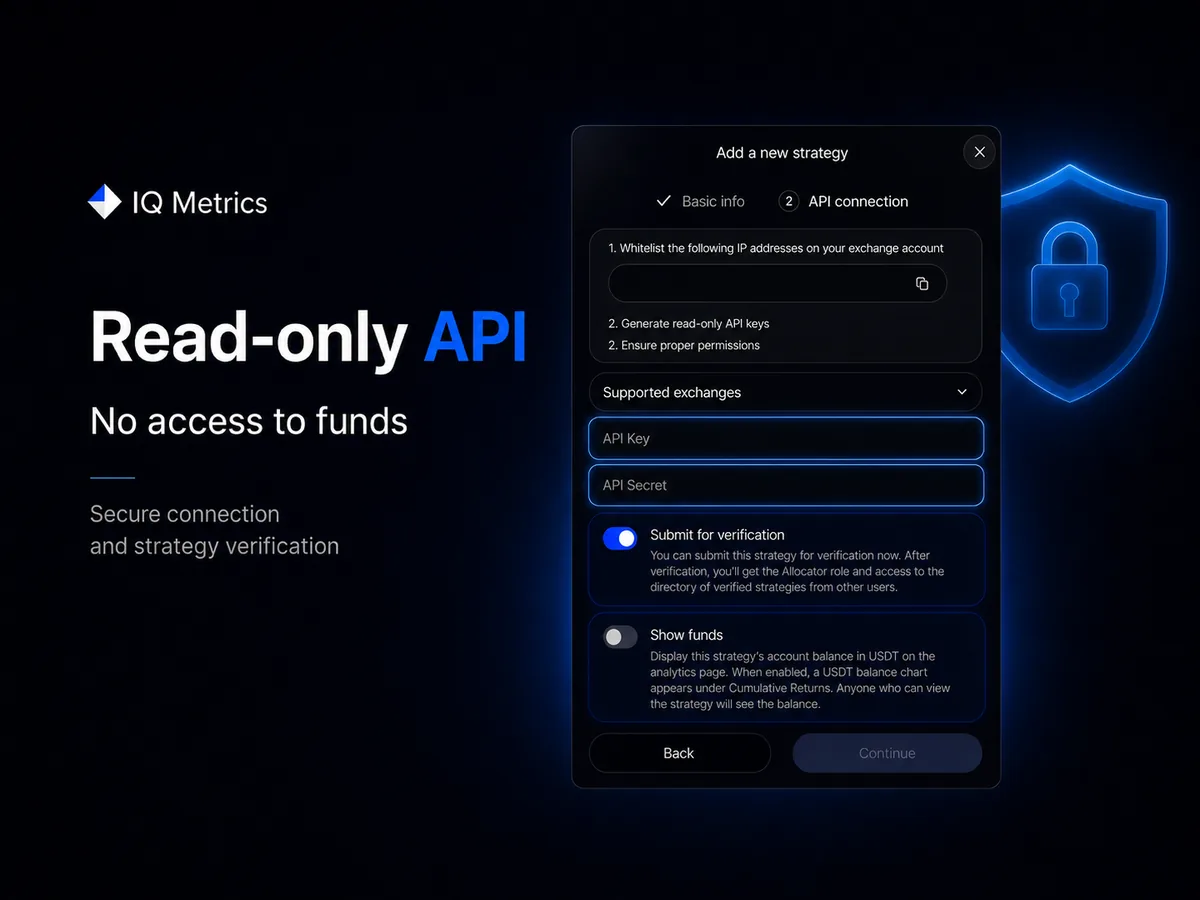
IQ Metrics connects to a trading account via API and turns raw trades into a clear and honest picture of performance. It is not a marketing report written by the trader himself. It is independent verification based on real exchange data.
The service does three key things:
Real-Time Performance Dashboard
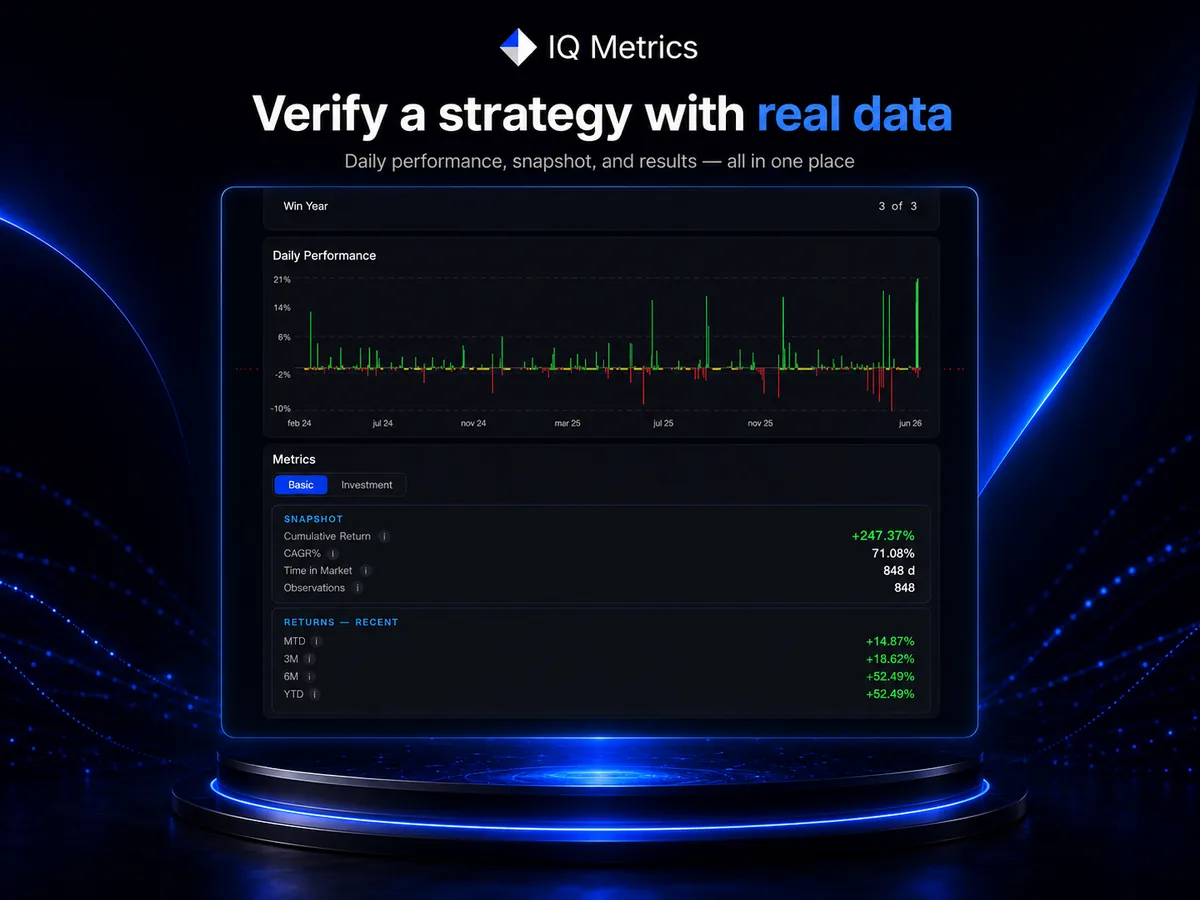
A live performance dashboard. You can see how the strategy is behaving right now, not just “after a successful month shown on a screenshot”.
Independent Strategy Verification
Independent strategy verification. Metrics are taken from the API, not from the author’s words, so they can be shown to an investor as proof, not as a promise.
Investor-Ready Reporting
Institutional-level reporting that can be shared with an investor, partner, or exchange without embarrassment.
Why this matters: the trust problem in trading
The main pain point of the market is not that there are too few strategies. It is that it is almost impossible to understand which ones are real. One trader shows returns but says nothing about drawdown. Another shows a series of profitable trades, but it may simply be luck over a short period. A third shows a smooth upward curve, while hidden risk sits underneath it and can wipe out the account in a single day.
In this situation, the investor is blind. He chooses based on packaging, not substance, and regularly pays the price. IQ Metrics gives visibility back. Instead of believing a screenshot, you get verifiable numbers from the original source. The conversation changes from “trust me” to “see for yourself”. There is also an option to quickly share the selected strategy with the right person.
What we highlight: not just Sharpe, but the full picture
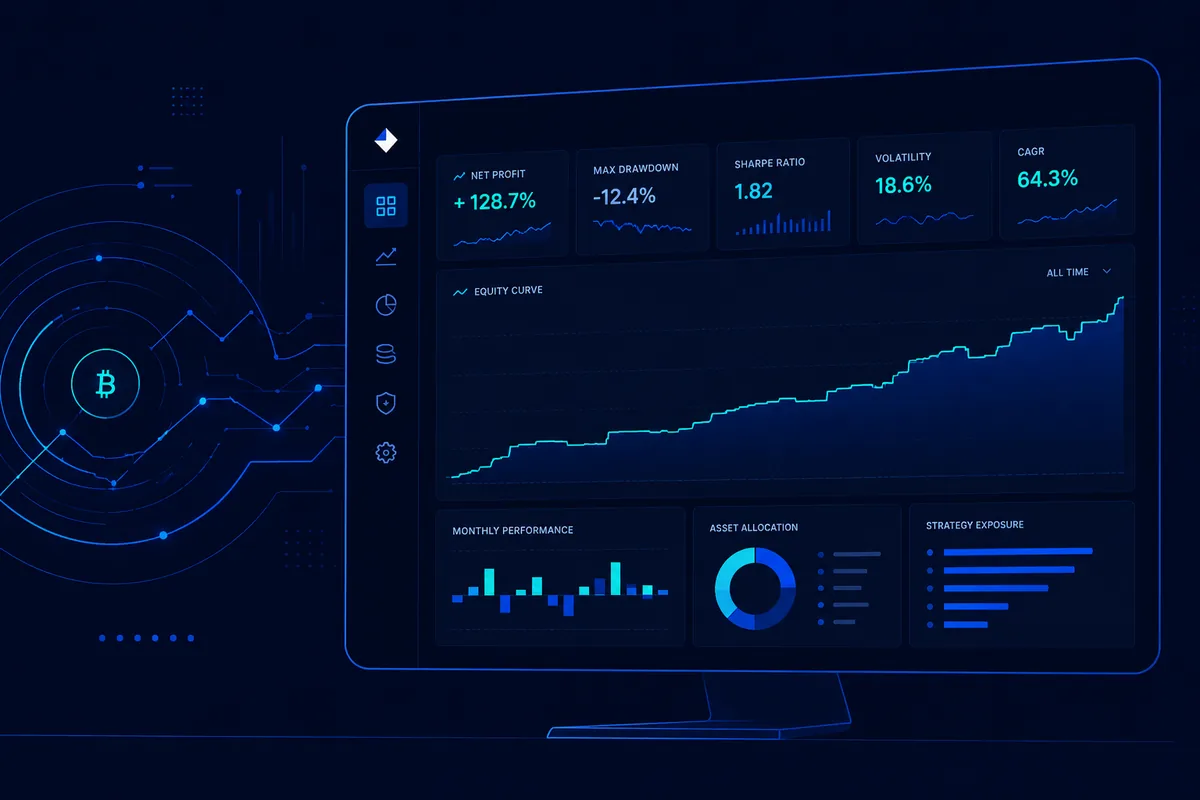
Strategies are often judged by a single number, most commonly the Sharpe Ratio. But one metric can lie very easily. The strength of IQ Metrics is that it shows a strategy from several angles at once. Together, the metrics reveal what each individual number can hide.
– Performance and returns. How much the strategy actually earned:
- total return;
- profit and loss dynamics;
- equity curve over time.
Not one number from the best month, but the full trajectory.
– Risk. This is the most important part and the one most often hidden. IQ Metrics shows maximum drawdown: how deeply the account fell at the worst moment. It also shows volatility: how much the account fluctuates. Risk answers the real question: not only how much you can earn, but whether you can actually withstand the path.
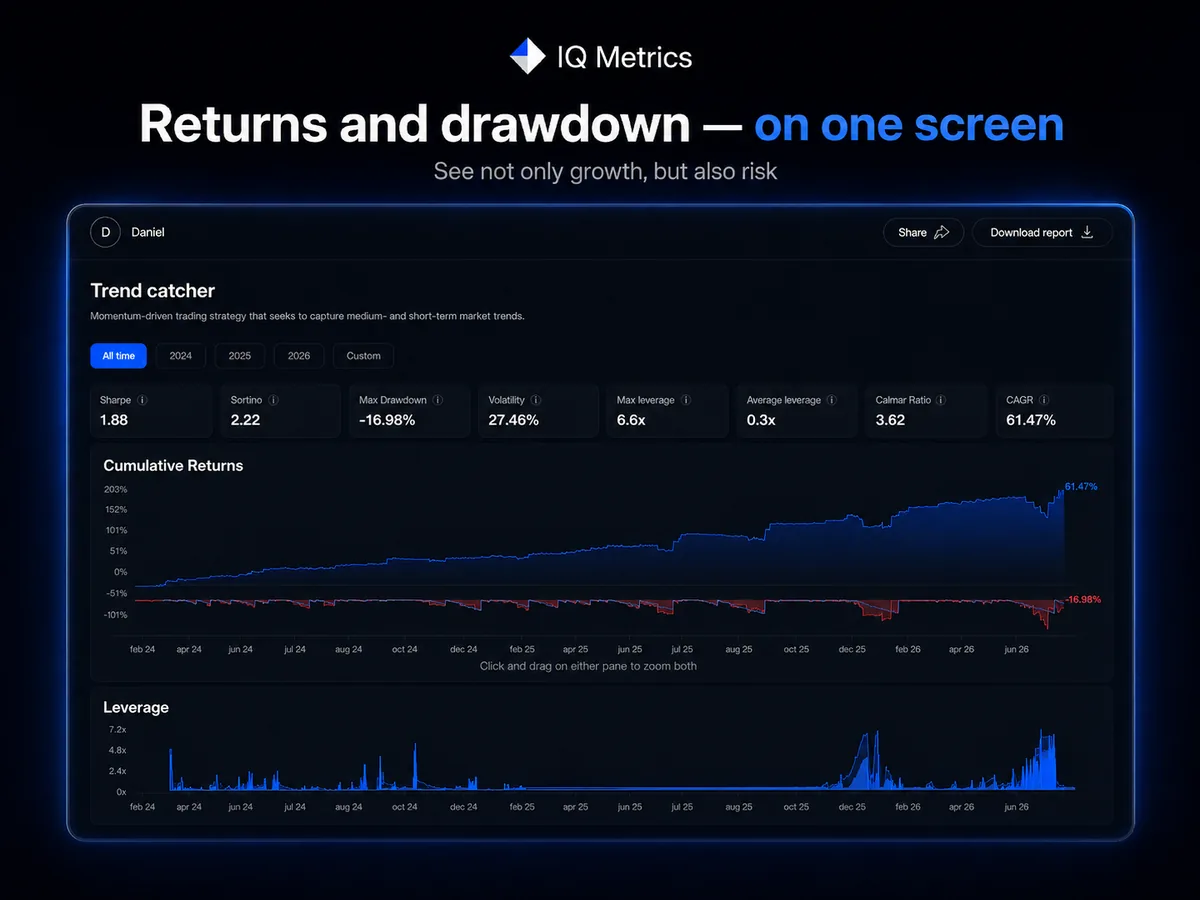
– Risk-adjusted return. This is where Sharpe comes in: how much return the strategy generated per unit of risk. Alongside it, IQ Metrics shows Sortino, which focuses only on harmful downside volatility, and Calmar, which compares return with the deepest drawdown. Together, these metrics show not just “how much the strategy earned”, but how expensive that return was in terms of risk.
– Stability and trade quality. IQ Metrics also shows:
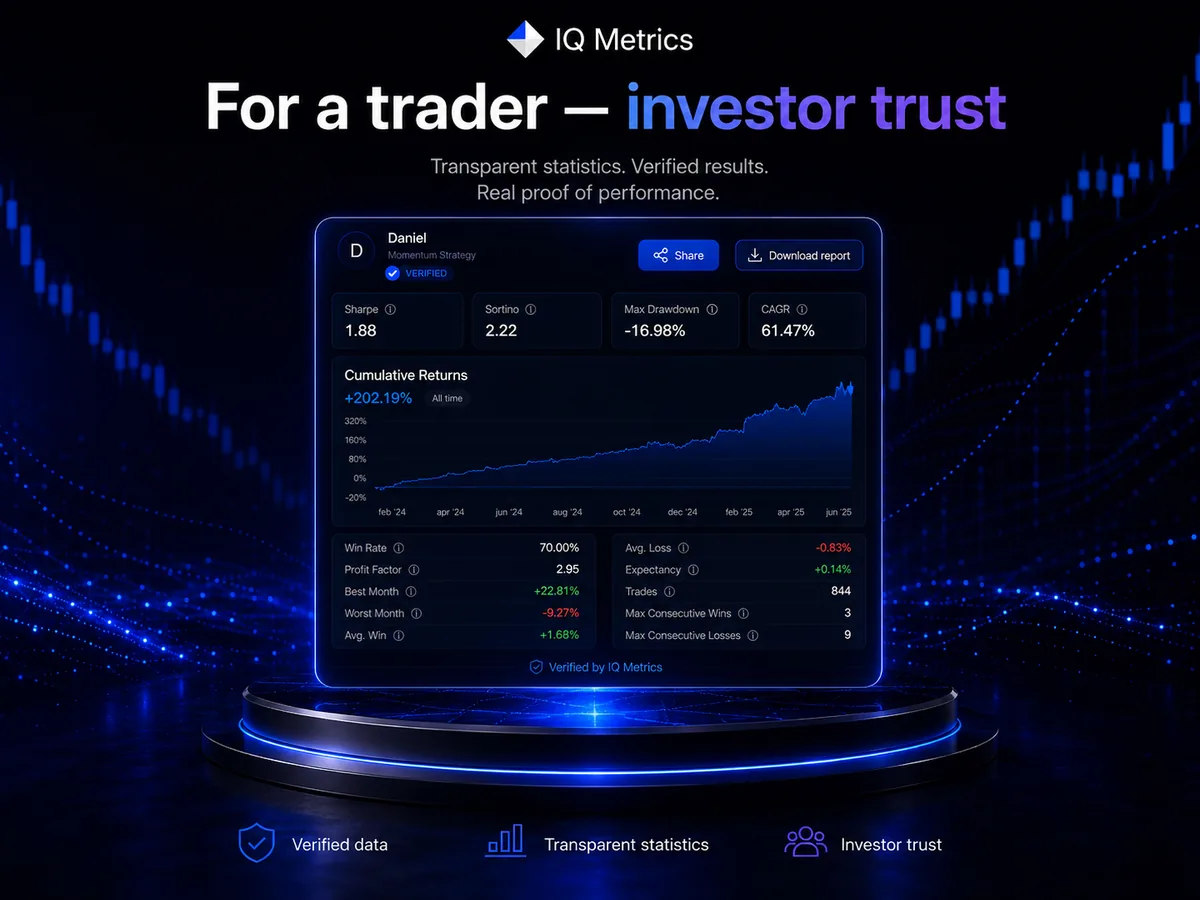
- percentage of profitable trades;
- average profit compared with average loss;
- number of trades;
- consistency of results.
This helps separate a real system from luck. A random hype trade becomes visible quickly. So does a stable trading pattern.
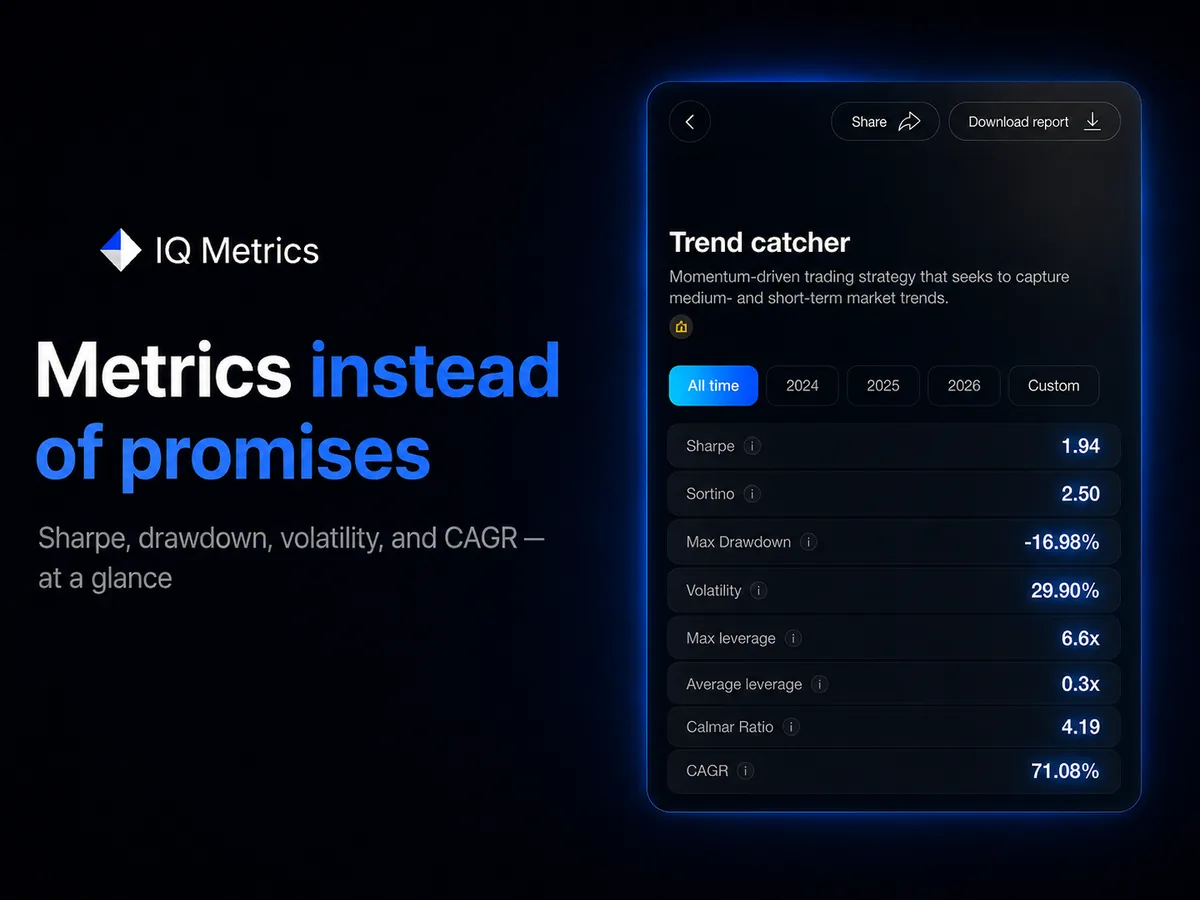
The idea is simple: Sharpe is one note, while IQ Metrics shows the whole melody. When the metrics are collected together and taken from the API, the overall picture becomes much harder to fake. A high Sharpe with a terrible drawdown, beautiful returns based on only a few trades, or a smooth curve hiding real risk – all of this comes to the surface.
Who IQ Metrics is useful for
Investors and people choosing who to trust with capital
Before allocating money to a strategy, copy trading product, or fund, you can see real numbers instead of a presentation. This is direct capital protection.
Traders and strategy authors
If the result is honest, IQ Metrics turns it into an asset: a verified track record that can be used to attract subscribers and investors. Proven numbers sell better than any promises.
Funds and managers
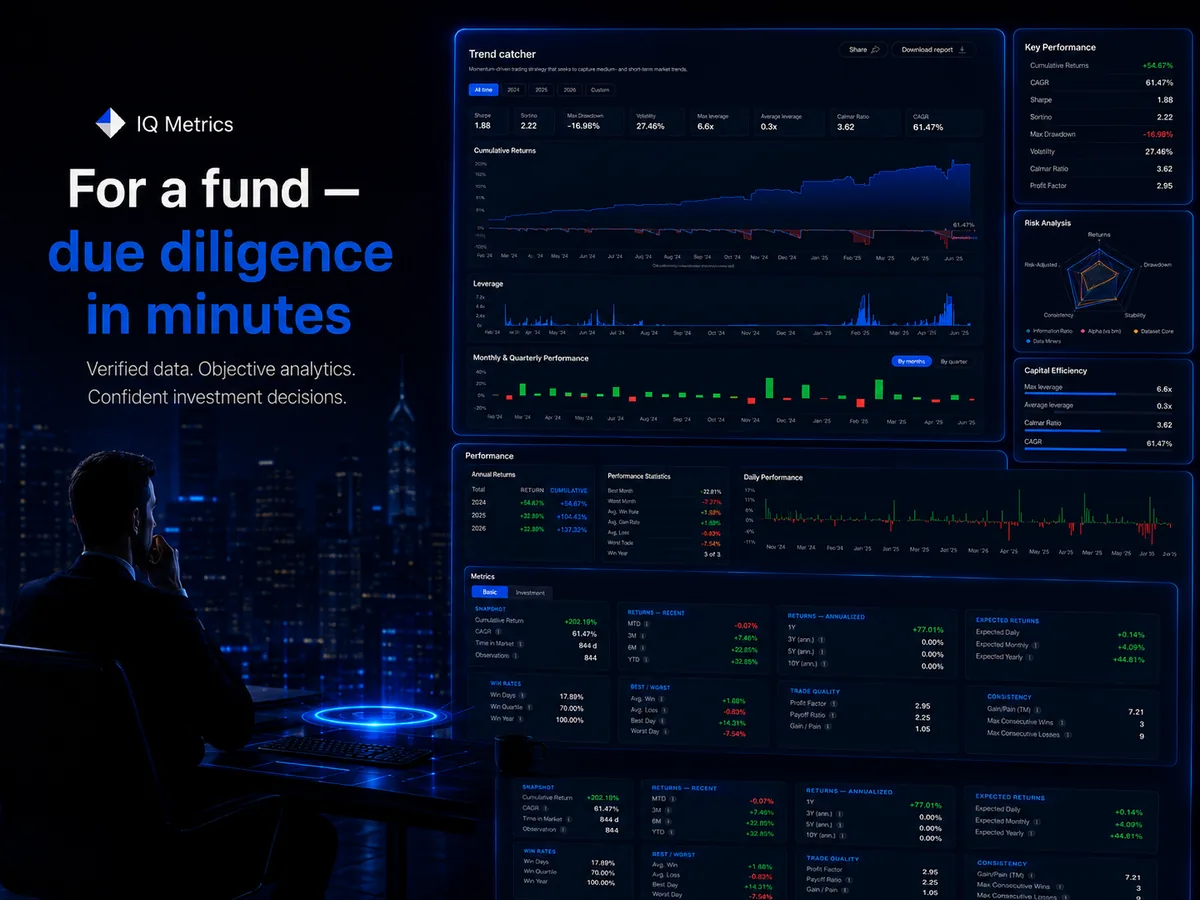
IQ Metrics provides transparent reporting for investors and partners, without manually drawing tables and without constant questions like “can we trust these numbers?”
Exchanges and platforms
This deserves a separate section because this is where the biggest scaling value appears.
Where IQ Metrics works as an exchange connection
IQ Metrics connects via API, which means it can be easily integrated wherever an exchange already works with traders. For an exchange, this is not an expense. It is a feature that increases trust and retention.
Copy trading and strategy marketplaces. Today, users often choose whom to copy based on a beautiful profile card. If verified metrics from IQ Metrics appear next to that profile, the choice becomes more informed and the platform becomes more transparent. Fewer disappointed users. Lower churn.
Leaderboards and trader rankings. Instead of ranking traders only by raw return, which often encourages taking excessive risk for a beautiful number, platforms can rank them by verified risk-adjusted metrics. This improves the quality of the entire exchange ecosystem.
“Verified by IQ Metrics” badge. An exchange can give traders a verification badge: a simple trust signal that users will quickly start looking for.
Partnership placement. An exchange can place a link on its platform:
“Want to prove your strategy or choose a reliable one? Use IQ Metrics.”
For the exchange, this is a useful service for its audience. For IQ Metrics, it is a stream of users. For the trader, it is a tool for fair competition. Everyone benefits.
That is why IQ Metrics is convenient to offer directly to exchanges: API integration is straightforward, the value is clear, and the format “place it on your platform with a link” works naturally because the service is genuinely useful for their own clients.
How to start using IQ Metrics
It is simple.
Go to iq-metrics.pro, view a live dashboard example, connect your trading account via API in read-only mode, and get an honest picture of your strategy.
If you are an investor, ask the strategy author to show their metrics in IQ Metrics before you allocate money.
If you are an exchange or platform, contact us about integration. We can connect via API and help with placement.
The market is tired of beautiful screenshots.
The winners are those who can prove results with numbers.
IQ Metrics was built exactly for this: verify strategies, prove your results, and make decisions based on data, not packaging.
Check your strategy or your trader’s strategy right now free at iq-metrics.pro.
Frequently asked questions
What is IQ Metrics and how does it verify a trading strategy?
IQ Metrics connects to a trading account through the exchange API and turns raw trades into a performance picture based on real data rather than a report written by the trader. Because metrics are pulled directly from the exchange in read-only mode, the numbers cannot simply be drawn by hand. This shifts the conversation from trust me to see for yourself.
Why isn't the Sharpe ratio alone enough to judge a trading strategy?
A single number like the Sharpe ratio can hide as much as it reveals, since a high Sharpe can sit alongside a terrible drawdown or a result based on only a few trades. IQ Metrics shows the full picture instead: returns and the equity curve, maximum drawdown and volatility, risk adjusted measures including Sortino and Calmar, and trade quality figures such as the percentage of profitable trades.
Who can benefit from using IQ Metrics?
Investors can see real numbers instead of a presentation before allocating money to a strategy or fund, direct protection for their capital. Traders and strategy authors get a verified track record that helps attract subscribers, funds and managers get ready-made transparent reporting, and exchanges can integrate it to raise trust and retention, for example through leaderboards or a verification badge.
How do you start checking a trading strategy with IQ Metrics?
You connect a trading account to iq-metrics.pro through the exchange API in read-only mode, which carries no risk to your funds, and the check itself takes about one minute and is free. Investors can also ask a strategy author to show their IQ Metrics numbers before allocating money, and exchanges can contact the service directly about integration.