Long Short: what the strategy is and where its returns come from

In this article, we’ll explore how Long Short strategies work, why their returns are not directly tied to market direction, where profits come from, and what risks arise when assets begin moving together.
Long short is a strategy that holds buy positions in some instruments and sell positions in others at the same time. Returns come not from the market rising, but from what was bought outperforming what was sold. The market itself can move in any direction, including down.
Hence the property the approach is used for: results are only loosely tied to whether the market is rising. This is not downside protection and not a promise of profit in all conditions. It is a different source of return, with a different set of risks.
Below: how it works in numbers, where the risks come from, in which periods the approach stops earning, and which metrics are used to evaluate it.
How it works on a simple example
Picture two coins in the same sector. One is bought, the other sold, with position sizes set to roughly offset each other.
The market falls ten percent. The bought coin loses eight, the sold coin loses twelve. Minus eight on the first, plus twelve on the second, a net plus four, even though the market went down.
The market rises ten percent. The bought coin gains twelve, the sold one gains eight. Plus twelve on the first, minus eight on the second, the same net plus four.
The market goes nowhere. The bought coin gains two, the sold one loses two. Plus four again.
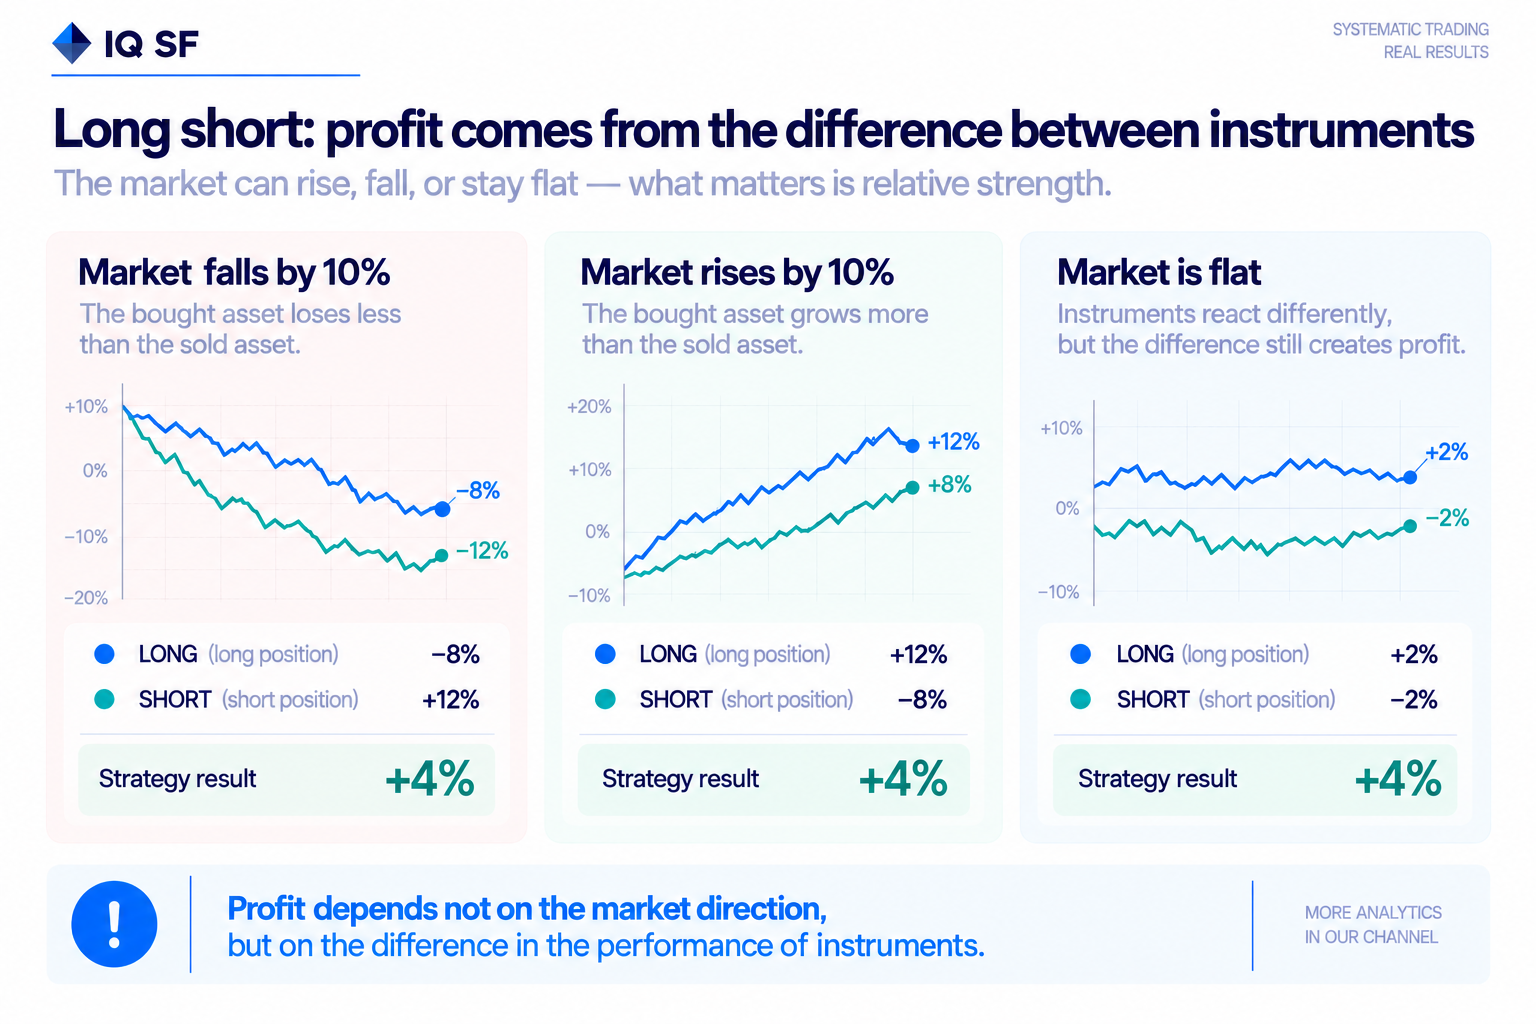
In all three cases the gain came not from a directional guess but from the difference in behaviour between two instruments, which amounted to four percentage points. That difference is what the strategy sells.
The reverse follows from the same example. If the bought coin turns out to be weaker than the sold one, a loss appears in any market direction, including a rising one. The error is not failing to predict direction but failing to predict relative strength.
How this differs from simply buying
Buying a rising asset earns on one factor: the market goes up. It is a clear source of return with an equally clear weakness. When the market turns, there is nothing left to earn on, and drawdowns in digital assets are measured in multiples rather than percent.
Long short earns on a different factor: the relative strength of instruments against each other. That factor exists in rising markets, falling markets and sideways markets alike.
This should not be turned into a promise. The relative strength factor disappears too, simply in different periods. When the entire market moves in unison, differences between instruments shrink to nothing and there is nothing left to capture. In digital assets such periods occur regularly, usually during broad panic or, conversely, broad euphoria.
The choice is therefore not between “earns always” and “earns on growth”, but between two different profiles of idleness.
Variants of the approach
Pairs trading. The simplest case: one buy, one sell, usually between related instruments. The result is driven by the convergence or divergence of that specific pair.
Market neutral construction. Many positions on both sides, sized so that total sensitivity to the market’s overall movement is close to zero. Income comes from aggregate difference rather than from any single pair.
Biased construction. More buys than sells, or the reverse. Part of the return comes from market direction, part from relative strength. Such a strategy cannot be assessed as neutral, although it is often described the same way.
The distinction matters when assessing someone else’s track record: in a rising market, a biased construction’s strong result may be almost entirely explained by that bias rather than by the quality of instrument selection.
Where the risks come from
Leverage. Holding buy and sell positions simultaneously requires margin on both sides, so borrowed leverage is almost always present. Leverage does not increase returns. It shortens the distance to zero. Two strategies with identical logic and different leverage are two different products in risk terms, though their descriptions read the same.
Cost of carrying positions. Perpetual contracts carry funding, a recurring payment between sides of the market. It is charged every few hours, never appears in a trade report, and on constructions holding both legs for weeks it becomes a permanent expense line.
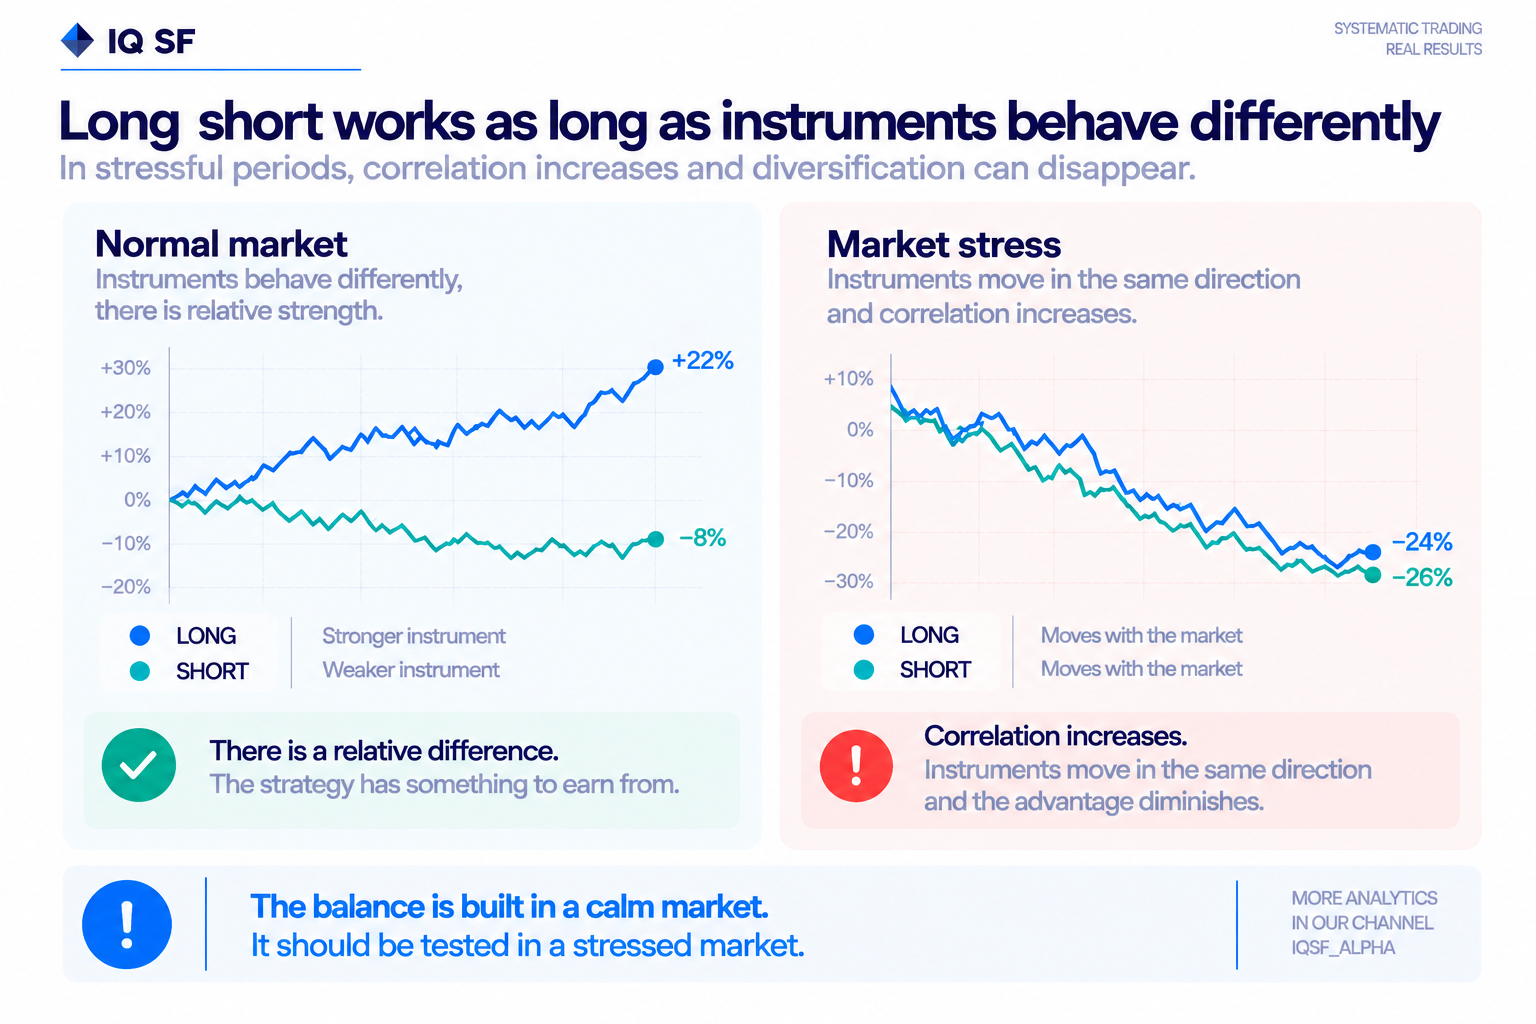
Simultaneous moves. Balancing rests on the assumption that instruments behave differently. In stressed markets that assumption breaks: correlations move toward one, and a portfolio of five pairs starts behaving like a single position at five times the size. A portfolio is balanced in calm conditions and tested in stressed ones.
Liquidity. Selling an illiquid instrument fills worse than the model assumes, and the gap between modelled and actual price widens precisely when the market moves fast.
Cost and availability of the short side. The ability to sell an instrument can vanish or become expensive at the worst possible moment, at which point a neutral construction turns directional without any decision by the manager.
When the strategy does not work
Better known in advance than discovered after the fact.
Broad one way moves, when the entire market goes in one direction and no differences between instruments remain.
Sharp reversals, when previously weak instruments rebound harder than previously strong ones. A construction built on the continuation of relative strength loses on both sides at once in that moment.
Periods of high funding, when the cost of carrying positions consumes the entire income being generated.
How to evaluate such a strategy
Headline returns are even less useful here than usual: they are set by the amount of leverage and say nothing about selection quality.
Maximum drawdown and recovery time. Two numbers, not one: depth and duration.
Leverage actually used at the worst moment, not the leverage permitted. Without normalising for this, comparing two track records is meaningless.
Trade count. A result built on thirty trades is indistinguishable from luck, however it looks.
Behaviour on days of broad movement, separately from the average result for the period: that is where the construction’s real risk shows.
Share of return coming from bias. If buys systematically outweigh sells, part of the result is ordinary directional income, and it will not be there in a falling market.
All of these are computed from operation history, available through a read only API key that can neither trade nor withdraw. We built IQ Metrics for this: the service reads the export and computes the metrics itself rather than taking them on trust.
Who it suits
An investor who wants returns that are not rigidly tied to a rising market, and who accepts a different set of risks in exchange: leverage, carrying costs, and periods when the relative strength factor simply does not work.
It does not suit anyone looking for protection against a falling market. Long short is not protection, it is a different bet. On a day when the whole market falls uniformly, such a construction can also end up negative, and that happens by design rather than by error.
In short
Long short earns on differences in behaviour between instruments rather than on market direction. Results are therefore loosely tied to growth, but tightly tied to whether instruments diverge from each other or move together.
Such a strategy is checked by drawdown, recovery time, actual leverage, trade count and behaviour on days of broad movement. Returns here are a function of leverage and mean nothing on their own.
Not an individual investment recommendation. Past performance does not guarantee future returns.
Frequently asked questions
What is a long short strategy, and where does its return come from?
A long short strategy holds buy positions in some instruments and sell positions in others at the same time, earning from what was bought outperforming what was sold rather than from the market rising. Results are only loosely tied to market direction: it is not downside protection or a promise of profit in all conditions, just a different source of return with its own risks.
Can a long short strategy make money when the overall market is falling?
Yes, its result depends on the relative strength between the bought and sold instruments, not on market direction. In one example, a market falling ten percent still nets a four percent gain when the bought coin loses only eight percent against a sold coin losing twelve percent. The same difference pays off in a rising or flat market too, but a weaker bought instrument produces a loss regardless of direction.
What are the main risks specific to a long short strategy?
Holding buy and sell positions at once almost always requires borrowed leverage, which shortens the distance to zero rather than raising returns. Perpetual futures carry a funding payment that becomes a permanent expense on positions held for weeks, and in stressed markets correlations move toward one, so a balanced portfolio behaves like one oversized position. Liquidity gaps and a costlier short side add risk at the worst moments.
When does a long short strategy stop working?
It stops earning during broad one way moves, when the entire market goes in one direction and differences between instruments disappear, and during sharp reversals, when previously weak instruments rebound harder than previously strong ones. Periods of high funding can also consume the entire income the strategy generates. These conditions are better known in advance than discovered after the fact.