Portfolio of trading systems: why the boring approach predates the hype

In this article, we’ll explore how a portfolio of trading systems differs from traditional asset diversification, why ten similar strategies can still represent a single bet, and how independent sources of return can help create more resilient performance across different market conditions.
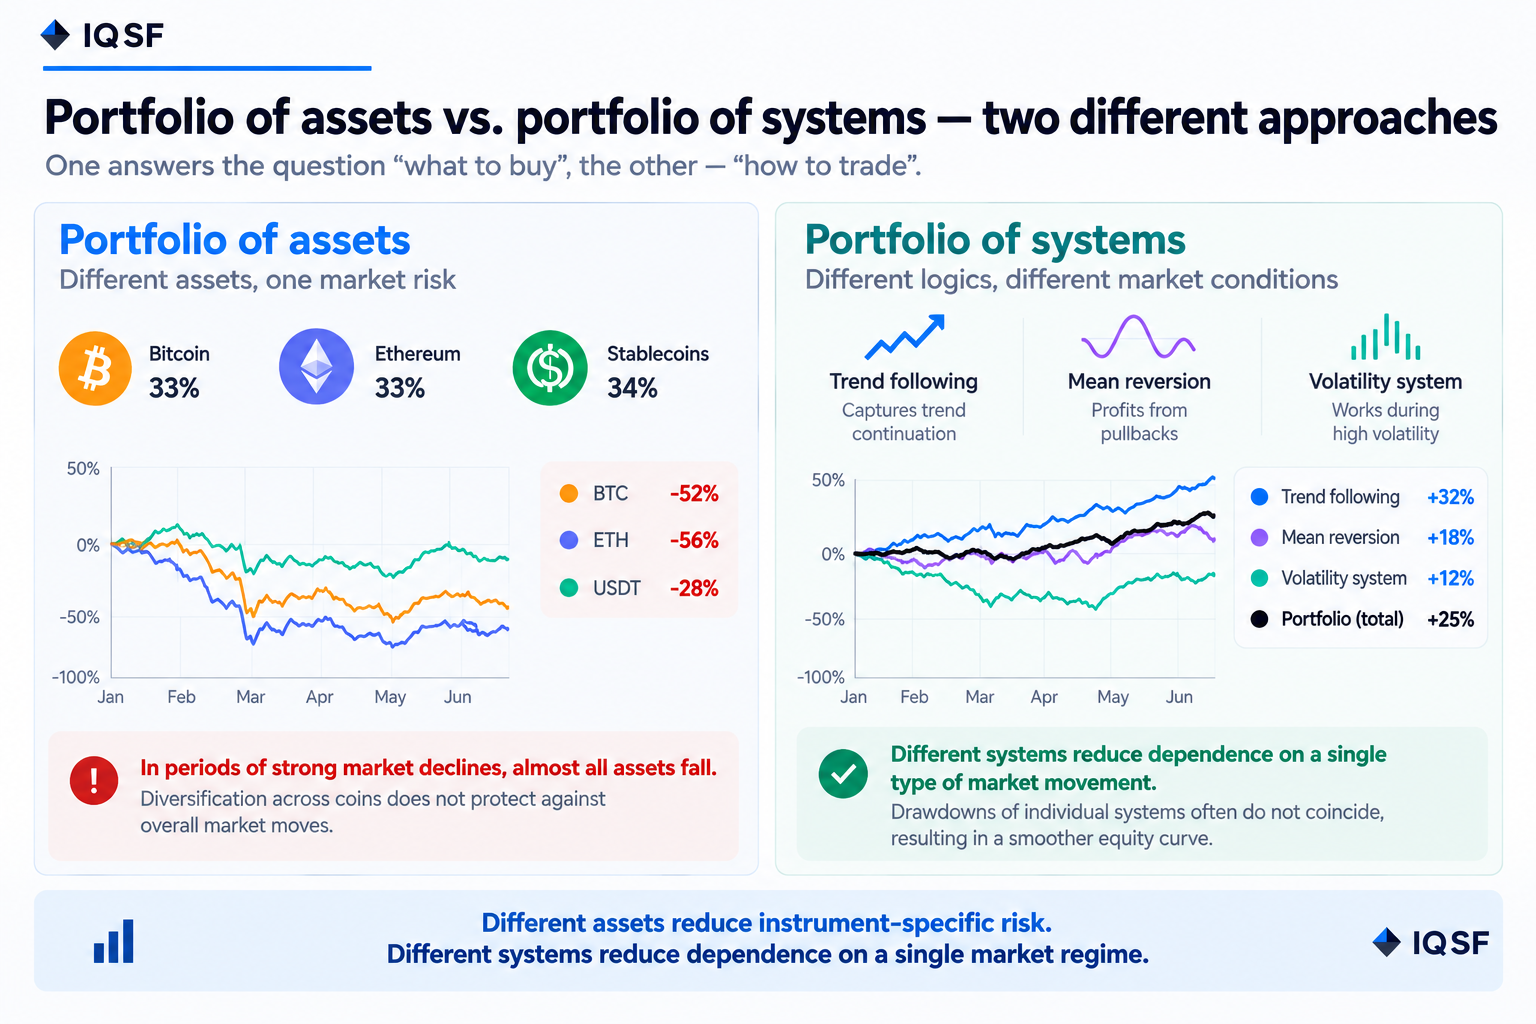
The phrase “portfolio approach” in trading covers two different things, and both have a right to the name. The first is a portfolio of assets: how much capital sits in bitcoin, how much in ether, how much in stablecoins. The second is a portfolio of trading systems: several independent sets of entry, exit and risk rules running at the same time on the same capital. Confusion starts where one is presented as the other, because these two approaches reduce different risks.
What follows is mostly about the second, because it gets discussed less. Its logic is that the losing periods of separate systems do not coincide: when one gives back, another earns, and the combined equity curve is smoother than any of them alone. The word “independent” is the load-bearing one here, and below is why it does not always hold.
The idea is over seventy years old. Harry Markowitz described the mathematics of diversification in 1952 and received a Nobel Prize for it. Trend following funds have run portfolios of systems since the 1970s. There is nothing new in it, and that is the main difference from what is sold today under the label “adaptive strategy”: the thing that works is usually old and boring rather than fresh and exciting.
Portfolio of assets and portfolio of systems are different things
A portfolio of assets answers the question “what to buy”: what percentage in bitcoin, what in ether, what stays in stablecoins. It reduces single instrument risk but offers no protection from a general market move. In March 2020 and in May 2022 almost everything fell at once, and diversification across coins helped no one.
A portfolio of systems answers the question “by what rules to act”. One system captures continuation of a move, another earns on price returning to its mean, a third works only during volatility spikes. Their results are weakly related not because the instruments differ but because the logic differs: what kills a trend system feeds a mean reversion system.
These are different ways of reducing risk and they do not substitute for each other. A portfolio of systems removes dependence on market direction: the correlation of our portfolio’s daily returns with bitcoin is close to zero. But it is vulnerable too, if the systems inside it are built the same way.
When diversification across systems does not work
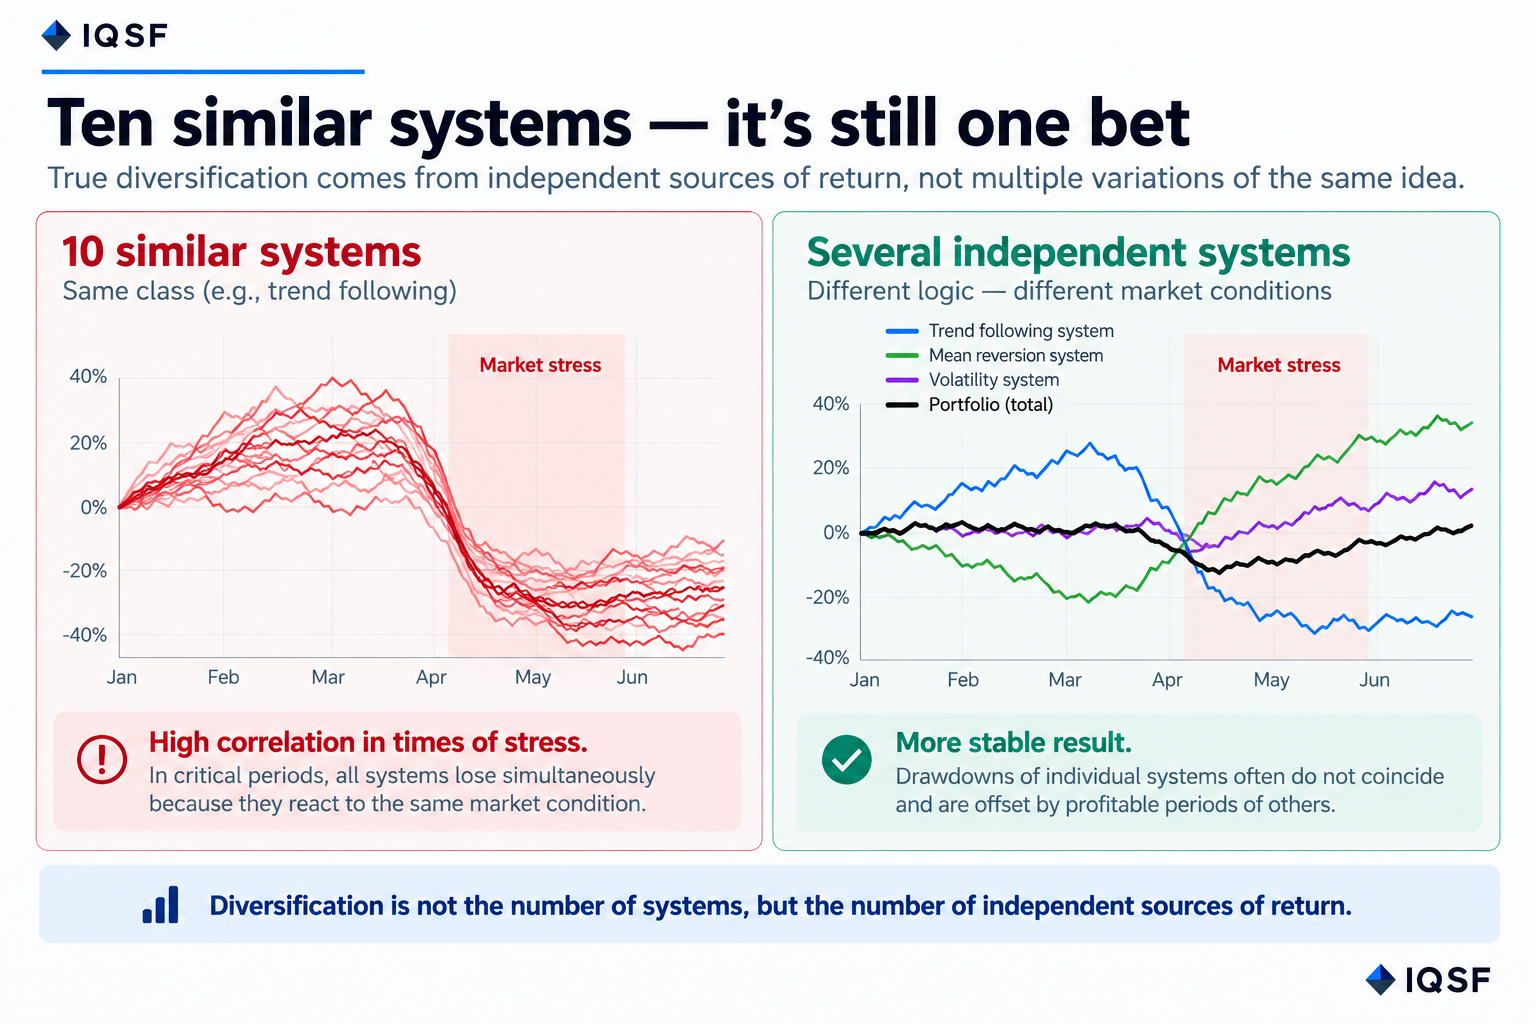
Increasing the number of systems guarantees nothing by itself. Spread capital across ten systems that all belong to one class, all trend, all momentum, all directional, and you do not get diversification, you get one bet split into ten parts. Different alphas and different parameters do not help: such systems share a source of return, and therefore share the condition under which the return disappears.
In calm periods the correlation between them looks moderate and the portfolio appears robust. The problem is that correlation is not constant. At the moment the market presents the same condition to all of them at once, a sharp reversal after an extended move, a volatility collapse, a synchronised stop run, homogeneous systems converge and fall together. Diversification stops working exactly when it is needed most.
December 2025 looked precisely like that for us: three baskets closed the month negative at the same time, minus 7.18 percent, minus 5.08 percent and minus 6.80 percent. Splitting across instruments and across parameters did not help that month, because the directional part of the portfolio reacted to one and the same market condition.
Hence the practical criterion: count independent sources of return, not systems. Two systems built on fundamentally different logic give more robustness than ten variations of one idea. And verify it not on a calm stretch but on the worst months: look at the correlation between systems specifically in the periods when the portfolio was losing, not on average across the whole history.
Why constant re-fitting to the market is not adaptivity
The most common substitution sounds like this: “our strategy adapts to the market”. In most cases what stands behind it is a regular recalculation of parameters against the last few months. It looks reasonable and is in fact the same curve fitting, performed continuously.
The mechanics of the error are simple. You fit the rules to what has already happened. The market changes phase. Rules tuned to the previous phase produce losses. You fit again. Each cycle looks like an improvement, and in aggregate you are always fighting the last war and systematically late to every regime change.
Real robustness looks different and far more boring. The rules are fixed. What changes is position size, not logic: the wider the market swings, the smaller the size at the same risk in money. The system does not guess the phase, it survives any phase at a known price. We do not re-tune parameters to the current market phase as a matter of principle: local fitting improves the short term picture and destroys the long term one.
What a portfolio of systems delivers in numbers
The value of diversification across systems shows up not in return but in the ratio of return to risk. A single aggressive system can deliver more percentage points, but its drawdown and recovery period make those points unreachable: few people sit through it.
On our Basket 70 strategy, across seven years of live trading since 2019, the annualised return is around 81.5 percent, the maximum drawdown 23.08 percent and the Sharpe ratio 2.96 (data as of the end of August 2026), with positions held one to three days. The design maximum acceptable drawdown is set at 30 to 35 percent: a reference level with a margin, derived from history plus stress modelling, not a guarantee. This is not a backtest; the track is live and pulled straight from the trading account.
The uncomfortable numbers deserve separate attention. Fewer than half of the portfolio’s days are profitable. That is not a defect but the design: the result is produced by the average winning trade being materially larger than the average losing one, not by being right more often than wrong. A system with nine winners out of ten usually does not close its losses, it waits for them to come back, and one day they do not.
How to tell a portfolio of systems from a set of indicators
• There are several systems, and each has its own description of logic, not a shared paragraph about “algorithms and machine learning”.
• It is known which market phase each part performs poorly in, and it was stated before it happened.
• There is a change log: what was changed in the rules, when and why. If the rules have not changed in years, that is a plus, not a sign of stagnation.
• Risk is measured at trade level and at portfolio level, and both numbers are stated in advance.
• The result of each part is visible separately, not only the combined curve.
The boring signs of a mature approach
A mature system does not promise growth without drawdowns and does not reinvent itself every quarter. It names its worst drawdown before being asked. It shows losing months alongside winning ones. It explains which repeatable market phenomenon it earns from, and that phenomenon has usually been studied for decades: momentum, mean reversion, volatility clustering.
All of which sounds less interesting than “the neural network found a new inefficiency”. That is exactly why it works: interesting, in markets, usually means untested.
FAQ
What is the difference between a portfolio of assets and a portfolio of strategies? A portfolio of assets spreads capital across instruments and reduces single instrument risk, but not the risk of a general market decline. A portfolio of strategies spreads capital across sets of trading rules with different sources of return, which reduces dependence on market direction. They protect against different things and one does not replace the other.
How many trading systems does a portfolio need? The count matters less than the number of independent sources of return. Ten systems of the same class behave as one position split into ten parts and fall together under the same market condition. Two systems built on genuinely different logic, for example trend following and mean reversion, deliver more robustness than ten variations of a single idea.
Why do uncorrelated strategies become correlated in a crisis? Correlation between systems is not a constant, it is a function of the market state. When the market presents the same condition to every system at once, a sharp reversal, a volatility collapse, a synchronised stop run, systems that share a source of return converge. This is why correlation should be measured specifically during the worst months rather than as an average across the whole history.
This material is for informational purposes only and does not constitute investment advice.
Frequently asked questions
What is the difference between a portfolio of assets and a portfolio of trading systems?
A portfolio of assets spreads capital across instruments like bitcoin, ether and stablecoins, reducing single instrument risk but not the risk of a general market decline. A portfolio of trading systems spreads capital across different sets of rules instead, reducing dependence on market direction because different logics profit in different conditions. The two protect against different risks, and neither replaces the other.
Why can ten similar trading systems still amount to a single bet instead of real diversification?
If all ten systems belong to the same class, for example all trend following, they share one source of return and the same condition under which it disappears. Correlation looks moderate in calm periods, but a sharp reversal or a synchronised stop run can hit all of them at once. What matters is the number of genuinely independent sources of return, not the number of systems.
Why can trading systems that normally look uncorrelated suddenly move together in a crisis?
Correlation between systems is not constant, it depends on the market state, and a sharp reversal or synchronised stop run can hit every system with the same condition at once. In December 2025 three of our baskets closed the month negative together, down 7.18 percent, 5.08 percent and 6.80 percent, because the directional part of the portfolio reacted to one and the same market condition. Correlation should be checked during the worst months, not averaged across history.
What drawdown is the Basket 70 strategy designed to withstand?
The design maximum acceptable drawdown for Basket 70 is set at 30 to 35 percent. It is a reference level with a margin, derived from history plus stress modelling, not a guarantee. The track is live and pulled straight from the trading account rather than a backtest, and fewer than half of the portfolio's days are profitable: the result comes from the average winning trade being materially larger than the average losing one.