Trading strategies: types and how to choose for your capital

In this article, we’ll explore the main types of trading strategies, where their returns come from, which market conditions they perform best in, and the risks behind each approach. We’ll also look at how to assess drawdowns and recovery periods and choose a strategy that fits your capital and risk tolerance.
What Is a Trading Strategy? The Five Parts Every Strategy Needs
A trading strategy has five parts: market, entry rule, exit rule, position size and loss limit; without any one of them, it is an intention that cannot be tested.
"Buy bitcoin when it gets cheaper" sounds like a plan but cannot be tested. "Buy if the daily close is above the 20-day high, sell on a close below the 10-day low, risk 1% of capital per trade" is a recipe: you can backtest it and repeat it tomorrow regardless of mood.
If a person makes the call on each trade, the strategy is discretionary; if software follows fixed rules, it is algorithmic. IQ Security Fund strategies are algorithmic and, according to the strategy dashboard, fully automated.
Types of Trading Strategies: Six Approaches by Source of Return
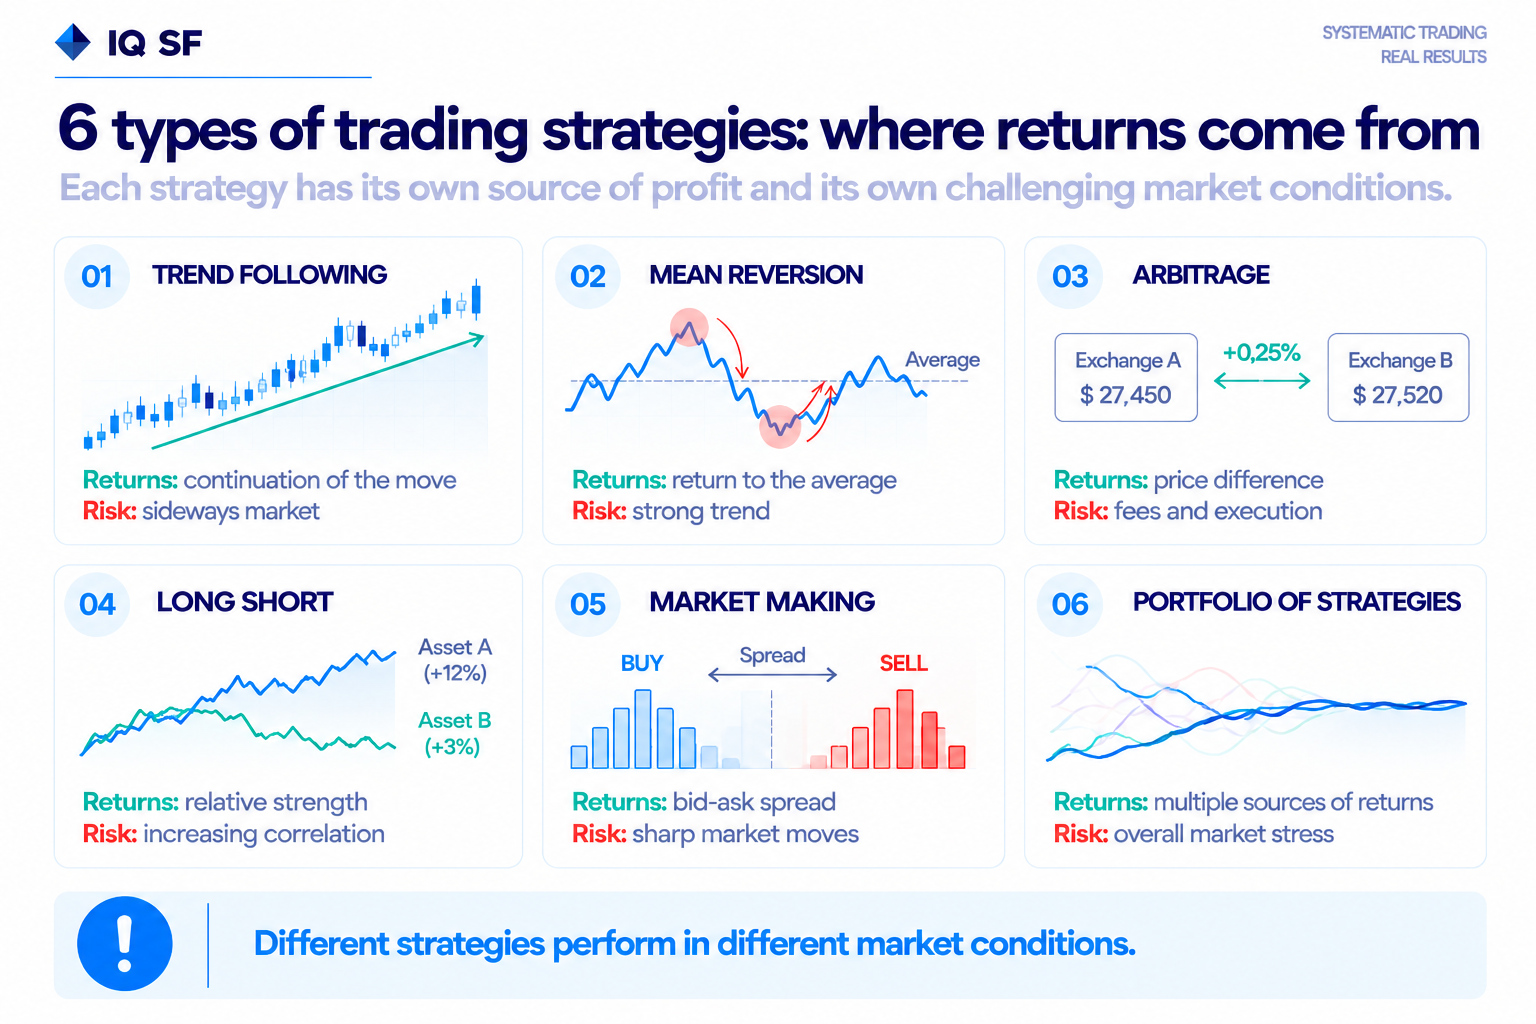
Types of trading strategies differ by source of return: trend following lives on continuation, mean reversion on pullbacks, arbitrage on price gaps in one asset, long/short on the difference between instruments, market making on the spread, a portfolio on several sources combined.
So every type has a known losing environment. Why the same period brings profits to some strategies and losses to others is covered in our article on market regimes.
Trend Following Strategies: Rare Big Wins, Streaks of Small Losses
A trend following strategy buys what is already rising and sells what is already falling, betting that the move continues; a few large moves make its profit, and it pays for them with streaks of small losses.
It loses in a sideways market, where every false breakout ends in a small loss. So trend systems often win fewer than half of their trades, which is fine as long as the average win is several times the average loss.
Mean Reversion Strategies: Frequent Small Wins, a Rare Large Loss
A mean reversion strategy bets on price returning to its average after a sharp deviation: most of its trades close in profit, but one deviation that turns into a trend can wipe out many months of gains.
A close relative is the grid bot built into many crypto exchanges: according to the Bybit and OKX help pages as of September 2026, it places buy and sell orders at set intervals inside a chosen price range. If price breaks down out of the range, the bot is left holding the asset at a paper loss.
Arbitrage and Long/Short: Returns Without Betting on Direction
Arbitrage makes money on price differences in the same asset, long/short on the difference in how two different instruments move; both depend little on whether the market rises or falls, but their margins are thin and costs decide a lot.
An arbitrage example: buy an asset on spot and sell the same amount in perpetual futures. Price moves barely matter anymore, and the return becomes the funding rate, a payment that longs and shorts regularly exchange. Its size depends on the market phase. Our calculation covers all BTCUSDT funding payments on Binance from September 10, 2019 to September 24, 2026: a constant-size short would have received 30.61% of its size in the best year of the series, the 2021 bull market, and only 4.16% in the worst full year, the 2022 bear market, 7.4 times less, all before fees.
Long/short loses when the whole market moves as one instrument: there is no difference to capture, while leverage and funding keep costing on both sides. Both structures are covered in our article on long/short and crypto arbitrage.
Market Making: Spread, Speed and Minimal Fees
A market maker keeps buy and sell orders in the book at all times and earns the difference; it is a strategy of thousands of small trades where speed, the fee level and inventory control decide the result.
In a sharp move, orders on one side fill one after another and inventory piles up against the trend. Exchanges give market makers separate fee terms that private investors cannot get, so pure market making stays with firms running their own infrastructure.
Portfolio of Strategies: Several Sources of Return Instead of One
A portfolio of strategies combines systems with different sources of return so that a weak stretch in one is offset by another; it smooths the result but does not remove periods when all components are down at once.
Trend following and mean reversion complement each other: the sideways market that hurts the first feeds the second, and the strong move that hurts the second feeds the first. According to the IQSF strategy dashboard, Basket 50, Basket 70 and Basket 70 TF are built from several trend following strategies with a mean reversion component, while Quantum Alpha combines trend following, statistical arbitrage and funding rate systems.
How to Choose a Trading Strategy by Drawdown Tolerance: Four IQSF Profiles
The main criterion for choosing a trading strategy is two numbers about yourself: the drawdown in money and the months without new highs you can sit through without closing the strategy at the bottom.
Four algorithmic strategies of IQ Security Fund show how different these numbers can be; the metrics are from the strategy dashboard as of September 27, 2026 for the baskets and September 28, 2026 for Quantum Alpha.
Metric | Basket 50 | Basket 70 | Basket 70 TF | Quantum Alpha |
Period | 2019-08-01 to 2026-09-27 | 2019-08-01 to 2026-09-27 | 2025-01-12 to 2026-09-27 | 2021-01-03 to 2026-09-28 |
CAGR | 81.66% | 80.89% | 83.98% | 19.03% |
Max drawdown | -28.59% | -23.08% | -32.46% | -3.94% |
Longest drawdown, days | 234 | 162 | 162 | 298 |
Past performance does not guarantee future results.
A shallow drawdown is not necessarily a short one. Quantum Alpha's longest drawdown is 298 days, almost ten months, longer than any basket's: even a loss of a few percent can last for months.
The historical max drawdown is not a ceiling. As of the snapshot date, the deepest and the longest drawdown of all four strategies belong to the current episode, which has not ended, so both figures can still grow. It makes sense to leave a buffer for a deeper and longer drawdown than the historical one. Basket 70 TF's series is shorter than the seven-year series of the other two baskets, so its metrics rest on fewer market periods.
Choosing a Trading Strategy for Your Capital: Small Account vs Large
Capital size shapes the choice of a trading strategy through costs, leverage and capacity (the amount a strategy can absorb without losing returns).
Costs. Exchanges cut the base fee at VIP tiers based on 30-day volume, so larger capital running the same strategy pays less, and with frequent trading hundredths of a percent matter. We recalculated the Basket 50 strategy trade log, 2,900 executions from September 5, 2024 to July 28, 2026: at Binance's base rate of 0.050%, fees over the period came to 44% of average capital, and at its VIP 2 rate of 0.040% only 35%, with identical signals.
Leverage. Small capital tempts people into leverage. Our calculation on daily Binance BTCUSDT spot candles from August 17, 2017 to September 24, 2026 (entry at the daily open, no stop, no margin top-ups): at 10x, 47.3% of longs and 58.1% of shorts would have been liquidated within a month. Leverage turns an ordinary drawdown into the loss of the whole position.
Capacity. Large capital faces the opposite limit: a big order moves the price against itself, so cross-exchange arbitrage and strategies in illiquid coins cannot absorb millions.
How to Choose a Trading Strategy in Five Steps
Choose a trading strategy from the inside out: acceptable loss and waiting time first, then screening by those two numbers, a track record check and the share of capital.
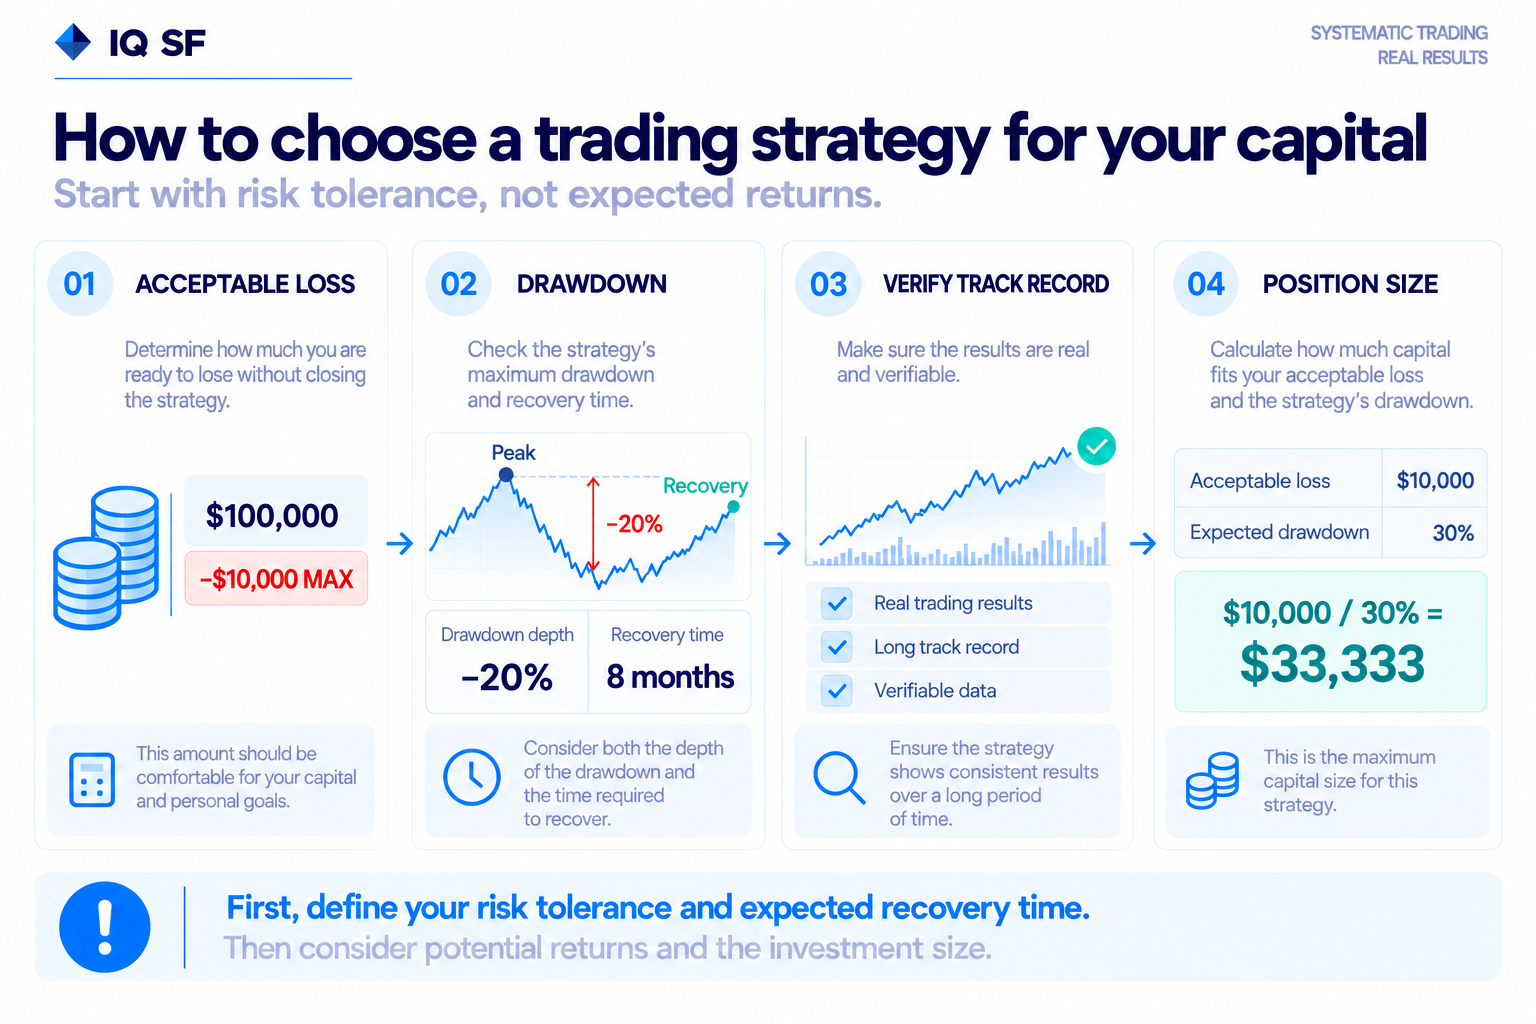
1. Acceptable drawdown in money. An amount you could lose without changing plans or closing the strategy at the bottom, for example $10,000.
2. Waiting time. Your horizon should clearly exceed the longest drawdown: if you may need the money in six months, a strategy that has already spent almost ten months below its high does not fit.
3. Screening by the two numbers. A candidate that fails on either drawdown depth or drawdown length is out, whatever its return.
4. Track record check. Live trading outweighs a backtest, a long series outweighs a short one, and every metric needs a snapshot date and a source you can open yourself.
5. Share of capital. Divide the acceptable loss by a planning drawdown deeper than the historical one: with a 20% historical drawdown and 30% planned, a $10,000 loss limit caps the amount at $33,333 (10,000 / 0.30), not $50,000.
Frequently asked questions
What is the most profitable trading strategy?
No strategy is the most profitable everywhere: each type makes money in its own market regime and loses in another. High returns almost always come with deep drawdowns, so a return means little without the depth and length of the drawdown.
Do trading strategies with a 90% win rate exist?
Strategies that win most of their trades do exist, mostly mean reversion systems and grid bots, but they usually pay for it with rare large losses. So the ratio of average win to average loss and the max drawdown matter more than the hit rate.
What is the best trading strategy for beginners?
Start with constraints rather than a strategy type: a small amount, no leverage, written entry and exit rules. By our calculation on daily bitcoin candles from 2017 to 2026, at 10x leverage almost half of long positions held for a month without a stop would have been liquidated.