Volatility explained: what it is and how to measure it
In this article, we’ll explore what volatility means, how to calculate it and how it differs from drawdown, why low price fluctuations do not always mean low risk, and how IQSF uses volatility metrics to evaluate trading strategies and manage risk.
Volatility is a measure of how much a price swings: the wider the spread of its daily changes, the higher the volatility. It is calculated as the standard deviation of returns and usually expressed per year: by our calculation, bitcoin's annualized volatility from August 2019 to October 2026 was about 60%.
Volatility tells you how wide the swings are, not which way they go, and not how much money can be lost in a row. That second question has its own measure, drawdown, and confusing the two can be expensive.
What is volatility and what does it show
Volatility shows how far a price usually strays from its average path, and it counts sharp rallies and sharp drops in exactly the same way.
Two assets can both gain 10% over a year. If the first moved half a percent up or down each day and the second moved 4%, the second has eight times the volatility, and its owner sits through much deeper dips along the way.
There are two kinds of volatility. Historical, or realized, volatility is calculated from past prices and shows how an asset actually behaved. Implied volatility is derived from option prices and shows how much movement the market expects: the more expensive protection against a sharp move, the higher it is.
If returns were normally distributed, about two years in three would end within a corridor of the average return plus or minus the annual volatility. In crypto this rule of thumb works worse, because large moves happen more often than a normal distribution predicts.
How to calculate volatility step by step
Volatility is calculated in six steps: daily returns, their average, deviations from the average, squared deviations, the square root of their average, and scaling to a year.
1. Daily return: today's closing price divided by yesterday's, minus one.
2. The average of all daily returns.
3. The deviation of each return from the average.
4. The squared deviations, summed and divided by the number of observations minus one.
5. The square root of the result: this is daily volatility.
6. Daily volatility multiplied by the square root of the number of trading days in a year: 365 for crypto, which trades around the clock, and 252 for stock exchanges.
A hypothetical example with five daily returns: +1%, -2%, +3%, -1% and +2%. The average is 0.6%. The deviations are 0.4, -2.6, 2.4, -1.6 and 1.4, their squares are 0.16, 6.76, 5.76, 2.56 and 1.96, and the sum is 17.2. Dividing by four gives 17.2 / 4 = 4.3, and the square root of 4.3 is about 2.07% a day. The square root of 365 is about 19.1, so annualized volatility is about 39.6%. For stocks, with 252 trading days, it would be about 32.9%.
In Excel the whole calculation fits in one formula: =STDEV.S(range of returns)*SQRT(365). STDEV.S divides by the number of observations minus one, just as in step 4.
You multiply by the square root of the number of days rather than the number itself because, when daily moves are independent, it is the squared deviations that add up over time, not the deviations. An annual volatility of 30% corresponds to roughly 1.6% a day.
Market volatility and the VIX index
Volatility of the market as a whole is tracked by indices derived from option prices, and for US stocks the best known is the VIX.
The VIX, calculated by Cboe, measures the 30-day expected volatility of the S&P 500 index, expressed per year. According to Cboe data, its average close since 1990 is 19.42. Its record close, 82.69, came on March 16, 2020; its intraday record, 89.53, on October 24, 2008; and its sharpest one-day jump, 115.6%, on February 5, 2018. On October 5, 2026, the VIX closed at 15.52, meaning the market expected calmer swings than average.
A high VIX does not predict a fall; it says that investors are paying more for protection against a large move in either direction.
Volatility vs drawdown: what is the difference
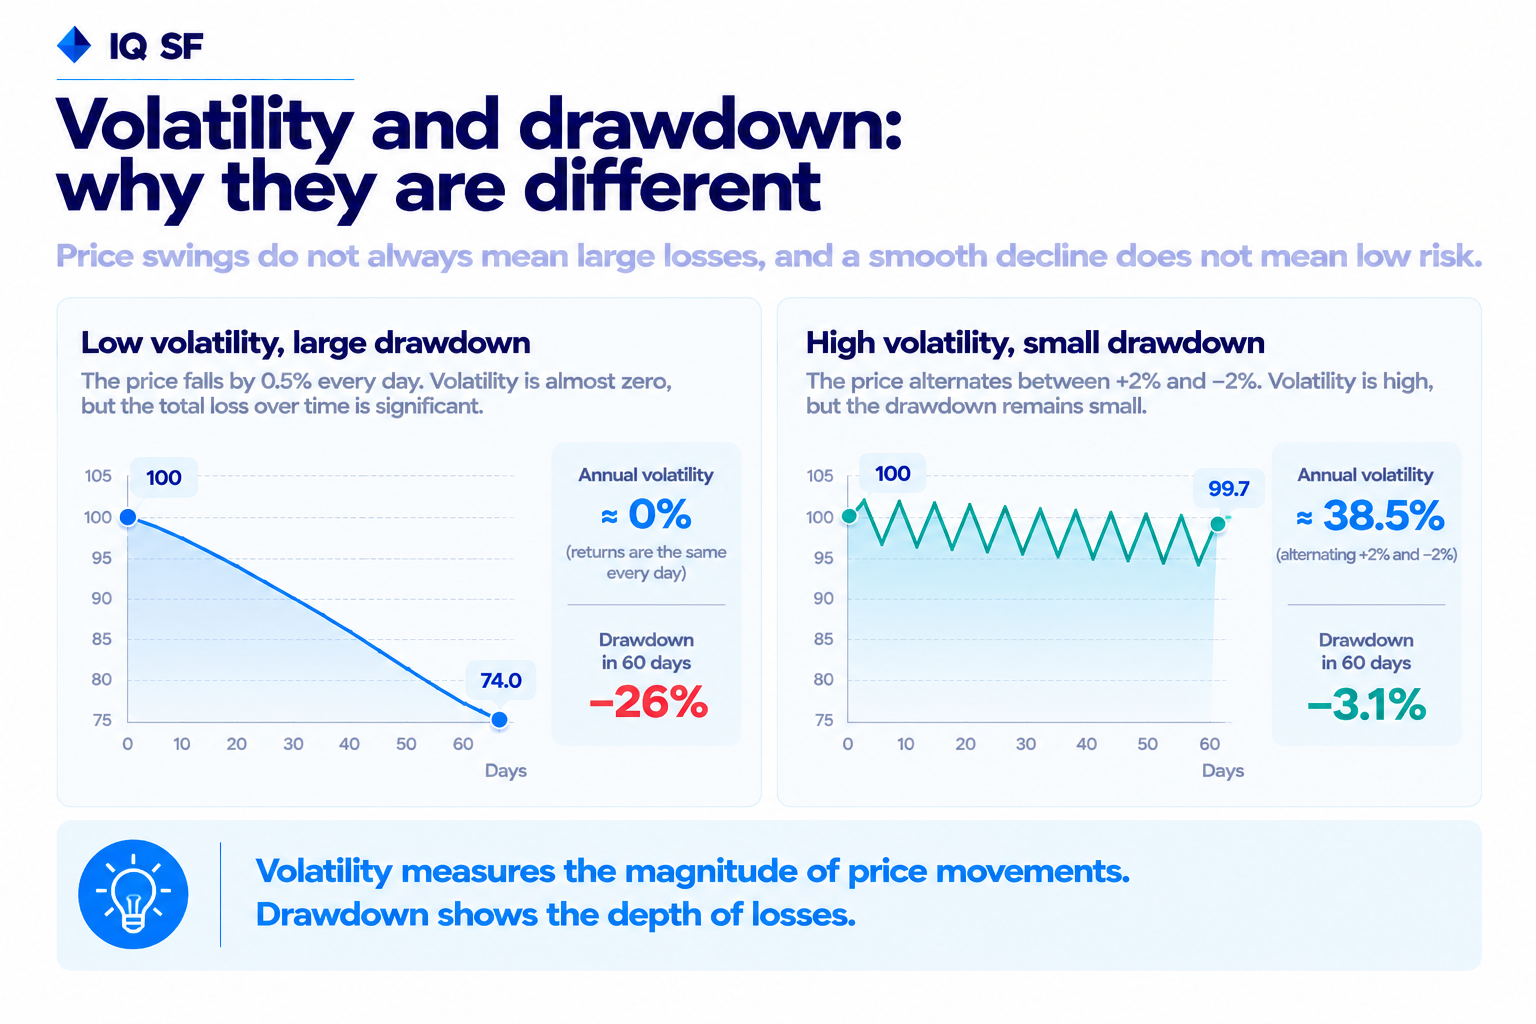
Volatility measures the spread of daily changes, while drawdown shows how much capital fell from its peak to its trough, so one cannot replace the other.
Take two hypothetical assets over 60 days. One that loses exactly 0.5% every day has zero volatility: all its returns are identical, so there are no deviations. Yet after two months it is down 26%. One that alternately rises and falls 2% a day has an annualized volatility of 38.5%, while its drawdown over the same 60 days is only about 3.1%.
There is a second reason not to rely on volatility alone. The usual rules of thumb assume a normal distribution, under which moves of more than three standard deviations occur on 0.27% of days. For bitcoin, from August 1, 2019 to October 4, 2026, there were 48 such days out of 2,622, six to seven times more, and on March 12, 2020 the price fell 39.5%, a move of 12.6 standard deviations. How to judge the depth and length of declines is covered in our article on drawdown.
Bitcoin volatility vs IQSF strategies
Volatility changes over time: by our calculation, bitcoin's was 81.1% in 2021 and 41.7% in 2025, and over the year to October 4, 2026 it stood at 44.8%.
The table shows annualized volatility and drawdowns over the period given in each row. For bitcoin it is our calculation from daily BTCUSDT closes on Binance; for the strategies it is data from the IQSF strategies dashboard as of October 4, 2026.
Period | Annualized volatility | Maximum drawdown | Longest drawdown | |
Bitcoin | Aug 1, 2019 to Oct 4, 2026 | 60.24% | -76.63% | 847 days, Nov 8, 2021 to Mar 4, 2024 |
Basket 50 | Aug 1, 2019 to Oct 4, 2026 | 30.06% | -28.59% | 241 days, since February 2026, still open |
Basket 70 | Aug 1, 2019 to Oct 4, 2026 | 27.37% | -23.08% | 169 days, since April 2026, still open |
Basket 70 TF | Jan 12, 2025 to Oct 4, 2026 | 37.92% | -32.46% | 169 days, since April 2026, still open |
The dashboard calculates annualized volatility the same way as the example above: the standard deviation of daily returns multiplied by the square root of 365. Low volatility does not mean no drawdowns. The maximum drawdowns of all three strategies came in 2026 and were still open on the snapshot date, and past performance does not guarantee future results.
Bitcoin was in a drawdown too: its October 4, 2026 close of $86,530 was 30.6% below the peak of $124,659 reached on October 6, 2025.
How funds and traders work with volatility
Professional market participants use volatility in two ways: they size positions to it, and they trade it through options as a risk of its own.
The first is simpler. If the aim is for every position to move the portfolio by a similar amount, position size is set in inverse proportion to volatility: in an asset with 60% volatility the position is half the size of one in an asset with 30%. When the market calms down, the position can grow; when it heats up, it is cut. Volatility also sits inside the Sharpe ratio, which divides the return above the risk-free rate by annualized volatility, so at equal returns the strategy with smaller swings has the higher Sharpe.
The second is more complex. An option's price rises with expected volatility, so the option buyer pays for protection against a sharp move, while the seller collects a premium and takes that risk on. Cboe notes that over long periods the volatility implied by S&P 500 option prices has tended to run above the volatility later realized, and that gap is what option sellers collect. The bill arrives on the days of spikes: on February 5, 2018, the intraday value of the XIV exchange-traded note, a product built to profit from falling volatility, dropped to 20% or less of the previous day's close, and Credit Suisse announced its early redemption. How different trading approaches are built around price swings is covered in our article on crypto market volatility.
This material is for information only and is not individual investment advice.
Frequently asked questions
What is volatility in simple terms?
Volatility is how widely a price swings around its average path. The more the price jumps from day to day, the higher the volatility, whether the asset is rising or falling.
How do you calculate volatility in Excel?
Calculate daily returns, then apply =STDEV.S(range)*SQRT(365) for crypto or use the square root of 252 for stocks. The first part gives daily volatility, and multiplying by the square root converts it to an annual figure.
What is bitcoin's volatility?
By our calculation from daily closes between August 1, 2019 and October 4, 2026, bitcoin's annualized volatility was 60.24%. By calendar year it ranged from 41.7% in 2025 to 81.1% in 2021.
Is high volatility good or bad?
On its own it is neither: it means wide moves in both directions. For a holder it means deeper dips along the way, and for an investor with a fixed time horizon it means the risk of having to sell at a bad moment.
Is volatility the same as risk?
Volatility is only one measure of risk: it shows how wide the swings are, not how deep or long the losses get. That is why maximum drawdown and the longest recovery period are read alongside it.