A portfolio of strategies: why three average ones usually beat one excellent one

In this article, we’ll explore why combining several trading strategies can be more effective than relying on a single high-performing one, how different sources of returns can reduce drawdowns and recovery time, why low correlation doesn’t always mean lower risk, and how to evaluate a diversified strategy portfolio.
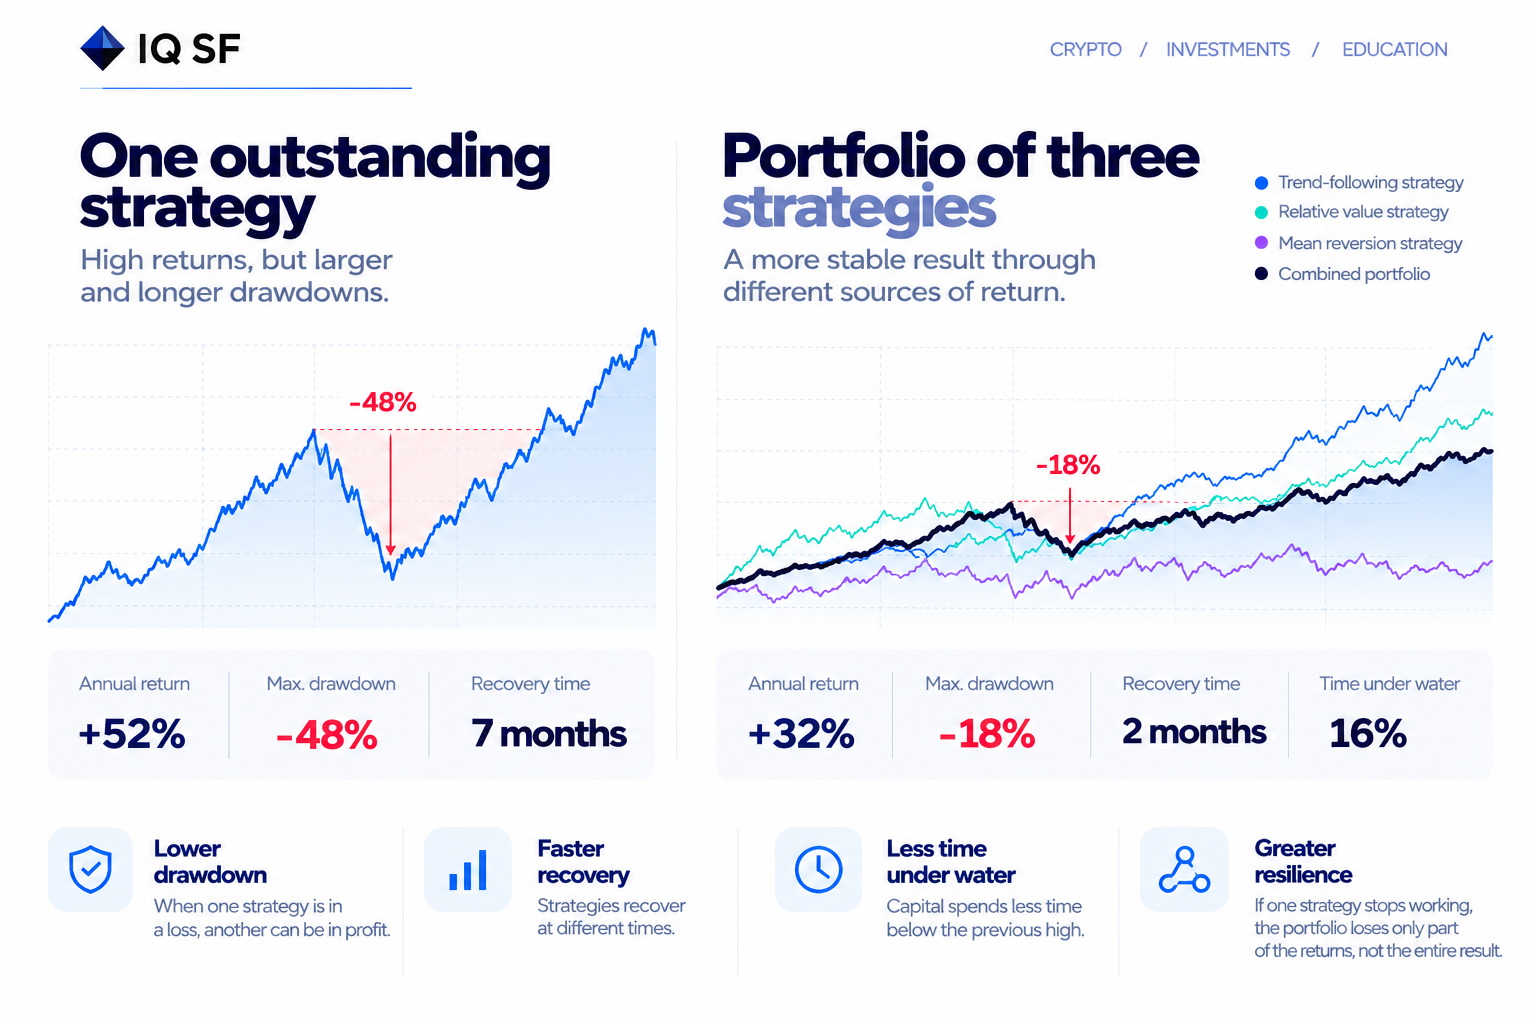
A portfolio of strategies means allocating capital across several ways of earning rather than across several assets. Three strategies with average figures, earning for different reasons, usually deliver a more liveable result than one strategy with the best numbers.
The reason is not returns but the shape of the curve. Any single strategy, however good, has bad periods, and those periods run consecutively. Investors tend to exit during exactly those periods, so an excellent strategy abandoned at the bottom did not work.
Below: what actually improves, the most common mistake, which sources of return genuinely differ, and how to test such a portfolio.
What actually improves
Drawdown depth. When one construction is down, another may be up, and the combined drawdown ends up shallower than the worst of them individually.
Recovery time. This matters more than depth, because duration is what breaks investors. Strategies do not recover simultaneously, and combined time under water shortens.
Share of time under water. A separate measure, rarely discussed: what proportion of the whole period capital spent below its previous peak. It describes a mode of existence rather than an event, and in a portfolio it shrinks more noticeably than depth does.
Resilience to one broken source. If the factor one construction earned on stops working, the portfolio loses part of its income rather than all of it. This is the only protection against the scenario where a strategy has not merely hit a bad period but stopped working permanently.
The probability of staying to the result. It does not appear in any backtest, yet it determines an investor’s actual outcome more than any computed metric.
What allocation does not improve is worth stating plainly: average returns. They become the portfolio average, meaning lower than the best strategy’s. That is the price of everything above; what is bought here is not return but the probability of living to see it.
The main mistake: five strategies with one driver
A portfolio of five constructions built on the same principle behaves on a bad day like one construction at five times the size.
The mistake is dangerous precisely because everything looks right: five different names, five different curves, low correlation of returns across the full history. Then a day of broad movement arrives and all five fall together, because they were earning on the same thing.
It is worth understanding separately why low correlation is not an argument here. The coefficient is computed across the whole sample, where the overwhelming majority of days are calm. Behaviour on the rare bad days simply drowns in that average. Two constructions can show near zero correlation over a year and coincide almost perfectly on the three days the portfolio was assembled for.
This is verified not by descriptions or by average correlation, but by behaviour on specific bad days in the past.
Which sources of return genuinely differ
Direction. Income from an asset rising. Requires a rising market; does not work in a falling one.
Divergence between instruments. Income from some instruments outperforming others. Does not require growth, but fails when the market moves uniformly across the board.
Price convergence. Income from prices returning to normal. Works in calm conditions, loses during prolonged dislocations. Drawdowns are short and deep.
Continuation of movement. Income from sustained trends in either direction. Loses in range bound markets, and drawdowns here are long and shallow, the opposite shape to the previous item.
Horizon. A construction working in minutes and one working in weeks respond differently to the same event, even on a shared principle.
A portfolio assembled from different items on this list is genuinely diversified. A portfolio of five variations on one item only looks diversified.
Combining sources with opposite drawdown shapes is especially useful: short and deep alongside long and shallow. They almost never arrive at the same time.
How many strategies make sense
Most of the benefit is captured across the first three or four genuinely different sources. Each additional one adds little, while the effort of monitoring grows linearly.
For a private investor, a sensible frame is usually two or three ways of earning that differ by source, with a clear rule for what to do if one of them stops working.
More important than the count: each component needs a pre defined condition for removal from the portfolio. Without one, a bad period is indistinguishable from a breakdown, and the decision gets made at the worst possible moment.
How to weight the components
A simple equal weight across components works better than expected, and noticeably better than elaborate calculations based on historical returns: those always assign more weight to whatever has already performed.
A more precise approach equalises components by their contribution to total risk rather than by amount invested. A leveraged strategy and an unleveraged one create different risk at the same nominal size, and equal cash weighting means unequal influence on the result.
What not to do: increase the weight of whichever component performed best over the last year. It is the most common and most expensive mistake in portfolio review, because it systematically buys at the peak.
How to check such a portfolio
Three questions and no complex maths.
First: what does each part earn on, and in which periods does that source not work. If the answer is the same for every part, there is no portfolio.
Second: what did the parts do on the worst market days of recent years. Movement in the same direction and of comparable size means one position.
Third: what was the combined drawdown and combined recovery time, rather than the sum of the individual ones. These must be computed from the merged curve, not added up across components.
All of this is computed from operation history, available through a read only key granting neither trading nor withdrawal rights. Our IQ Metrics service assembles these figures from that export, including behaviour in specific periods.
In short
A portfolio of strategies reduces dispersion and shortens time under water rather than raising returns. The price is average returns instead of the best ones.
It works only when the parts earn for different reasons. Five strategies on one principle are one strategy at five times the size, and the first day of broad movement will reveal it.
A low annual correlation does not refute this: it is computed from calm days, while the rare bad ones decide the outcome.
Not an individual investment recommendation. Past performance does not guarantee future returns.