Recovery period and portfolio stress testing: how to measure the risk of an investment strategy

In this article, we’ll explore why recovery time can matter more than the depth of a drawdown, how portfolio stress tests reveal risks that average returns hide, and why investors should evaluate a strategy not only by performance, but by how it behaves under pressure.
In March 2000, the Nasdaq index reached its peak during the dot-com bubble and then collapsed. It returned to its previous level only in 2015, fifteen years later.
The depth of the decline matters, but it was the recovery period that determined which investors actually survived that crisis without changing their life plans, and which did not.
The return of an investment strategy is only half of the picture. The second half, which investors often underestimate, is the recovery period: how long the portfolio remains below its previous high before it returns to that level after a drawdown.
Why the recovery period matters more than the drawdown itself
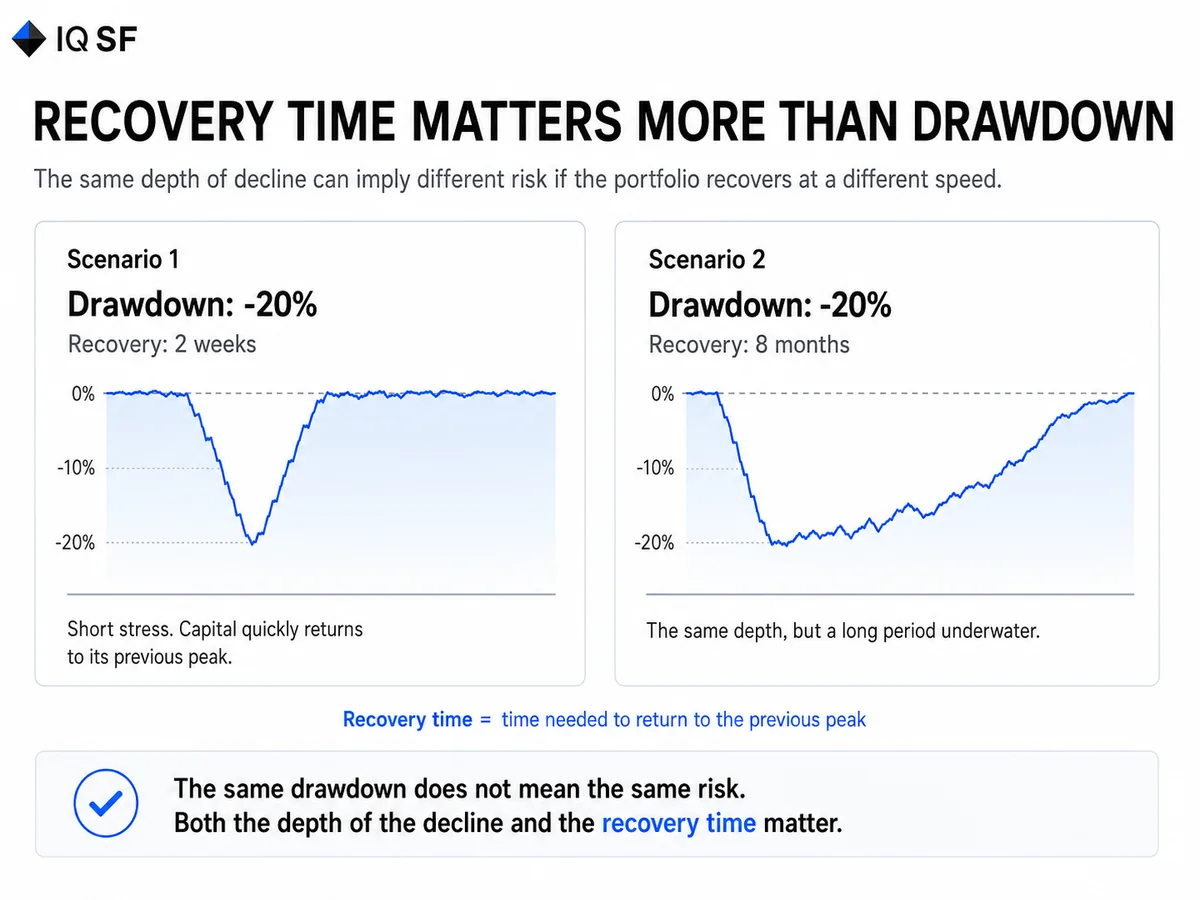
Maximum drawdown shows how deeply a portfolio can fall. The recovery period shows how long that fall will last, both psychologically and practically.
A 20% portfolio drawdown that lasts two weeks and the same 20% drawdown that lasts eight months are two completely different strategy risks, even though the depth of the decline is the same.
It is similar to the difference between a sprained ankle and a broken leg: the pain may feel similar in the moment, but the time it takes to return to normal life can differ dramatically.
Recovery factor, meaning the ratio of cumulative return to maximum drawdown, helps compare different investment strategies more honestly than simply looking at annual return.
A strategy with lower return but faster capital recovery can often be better in practice than a strategy with higher return but a long period spent underwater.
Stress test: how a strategy is checked before real capital
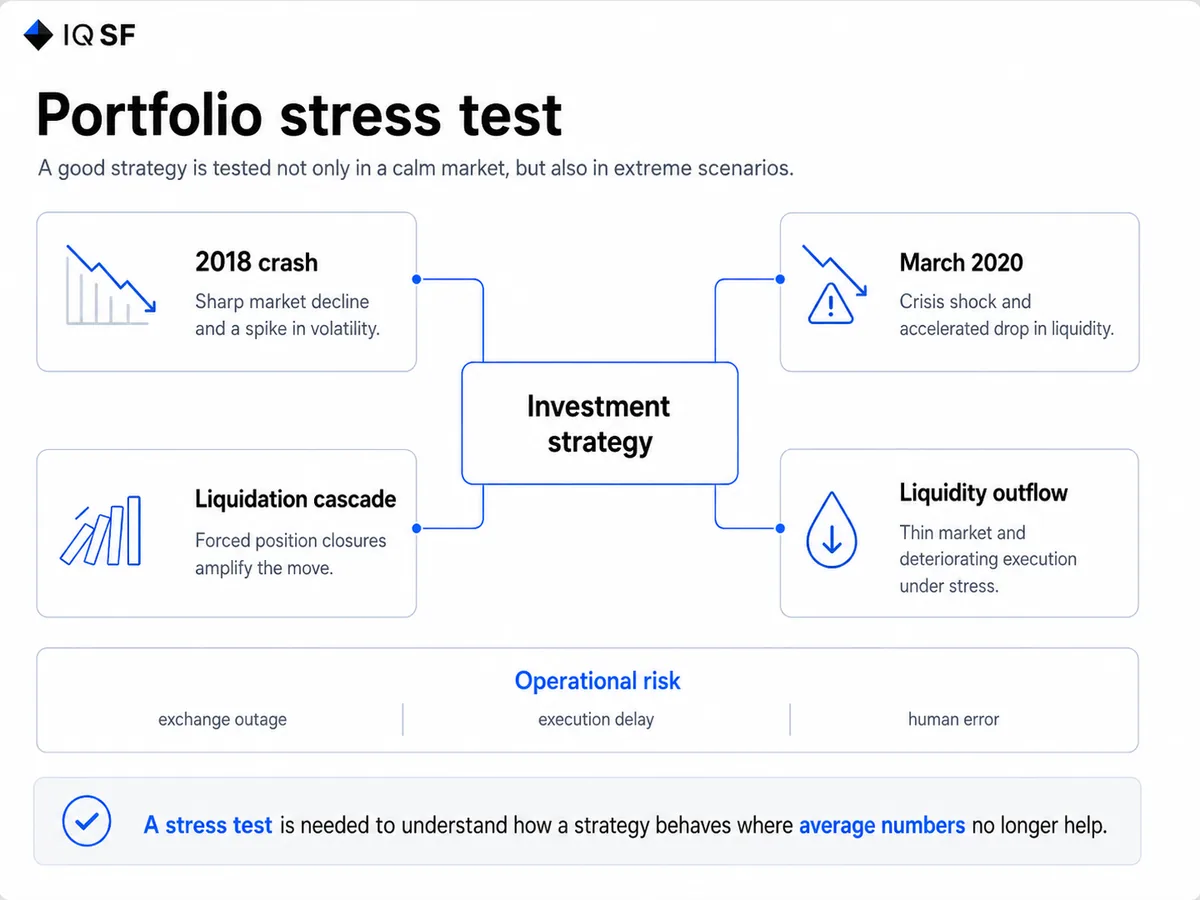
A stress test is a way to see how an investment strategy would have behaved in extreme historical conditions.
A proper scenario analysis is not built on one smooth scenario, but on a series of harsh conditions:
- the 2018 market crash;
- the March 2020 collapse;
- a liquidation cascade on a specific exchange;
- a sharp liquidity outflow within a narrow time window.
It is often the unlikely conditions that define the real risk of a strategy over a long horizon, not its average behavior during a calm period.
Operational risk management complements the stress test from another side: not through market movement, but through infrastructure failure, exchange failure, execution delay, or human error at the moment of maximum market stress.
Investment risks rarely appear one by one. More often, market risk and operational risk coincide exactly during a crisis.
Risk metrics that are actually worth watching
In addition to the recovery period and recovery factor, the basic risk metrics include:
- Market risk: the strategy’s sensitivity to the overall market movement.
- Risk-return: the relationship between expected profit and possible losses.
- Volatility management: the strategy’s ability to smooth sharp fluctuations without manual intervention during moments of panic.
- Maximum drawdown: the depth of the worst historical capital decline.
- Current portfolio drawdown: the current state of the portfolio relative to its previous high.
Portfolio risk cannot be evaluated using one metric in isolation. That is why professional management looks at the recovery period, maximum drawdown, stress test, and risk metrics together, rather than choosing one convenient number for a presentation.
Practical takeaway for investors
Before evaluating the return of an investment strategy, it is worth asking the manager three specific questions:
- What was the strategy’s historical recovery period after its worst drawdown?
- Has the strategy passed a stress test on real crisis periods, not only on a rising market?
- How does its recovery factor compare with alternatives over the same horizon?
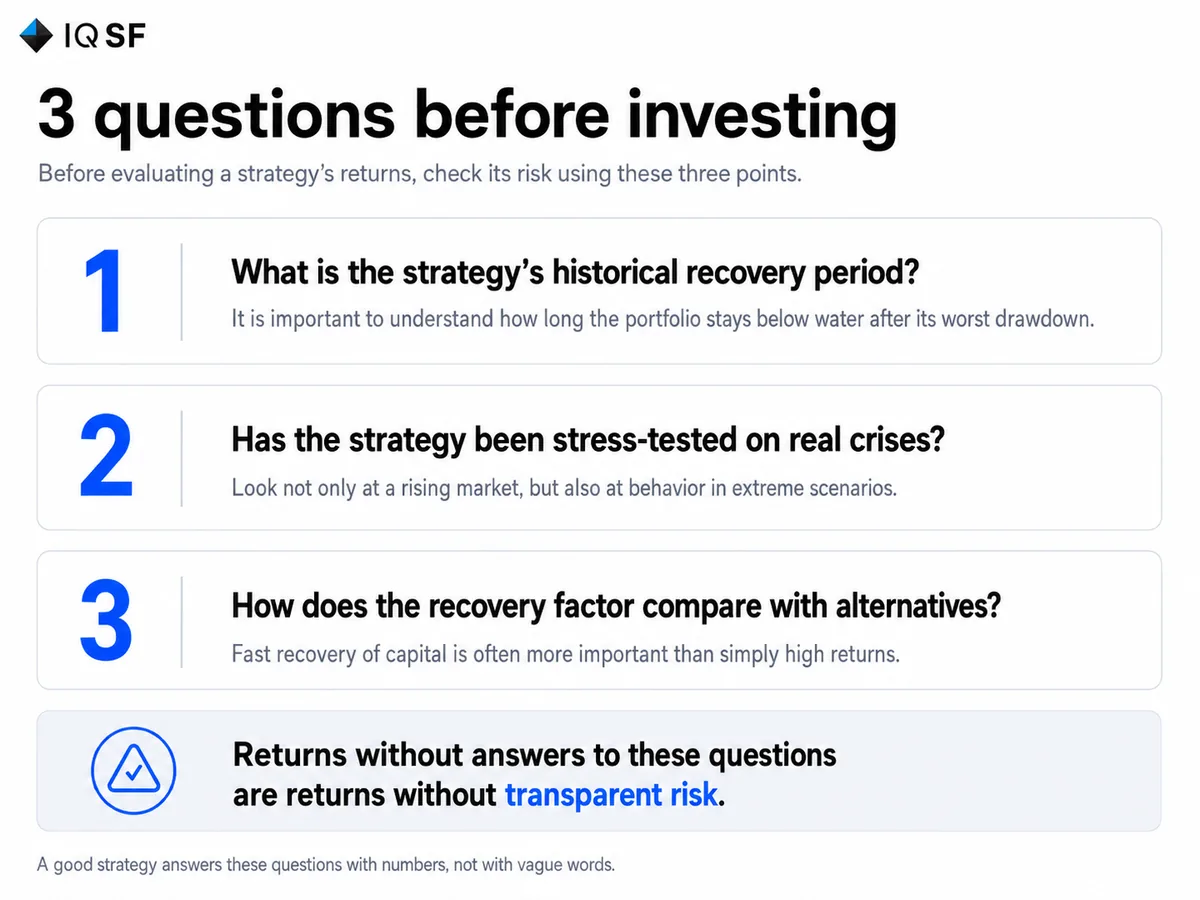
A strategy that cannot answer these questions offers returns without transparent strategy risk. That is exactly the situation where an investor may be taking more risk than they realize.
A strong investment strategy is not afraid of these questions. It answers them with numbers, not with vague statements about a “unique approach” and “time-tested expertise.”
This is not investment advice. It is an explanation of how to evaluate the risk of an investment strategy beyond a single annual return figure.
Frequently asked questions
Why does the recovery period after a drawdown matter as much as the drawdown itself?
Because the same depth of decline can represent very different risks depending on how long it lasts. A 20% portfolio drawdown that lasts two weeks and the same 20% drawdown that lasts eight months are completely different strategy risks even though their depth is identical, similar to the difference between a sprained ankle and a broken leg.
What is a recovery factor and why is it useful for comparing strategies?
It is the ratio of cumulative return to maximum drawdown, and it allows a more honest comparison between strategies than looking at annual return alone. A strategy with a lower return but faster capital recovery can be better in practice than one with a higher return that spends a long time underwater.
What does stress testing an investment strategy actually involve?
It means checking how the strategy would have behaved during extreme historical conditions, such as the 2018 market crash, the March 2020 collapse, a liquidation cascade on a specific exchange, or a sharp liquidity outflow in a narrow time window, rather than only a single smooth scenario. These unlikely conditions often define a strategy's real risk over a long horizon more than its average behavior during calm periods.
What questions should an investor ask a manager before trusting a strategy's returns?
Ask what the strategy's historical recovery period was after its worst drawdown, whether it has passed a stress test on real crisis periods rather than only a rising market, and how its recovery factor compares with alternatives over the same horizon. A strategy that cannot answer these questions with numbers is offering returns without a transparent picture of its risk.