Diversification in plain terms: what it is and when it stops working

In this article, we’ll explore how diversification works and helps manage investment risks, why holding more assets doesn’t necessarily protect against losses, how correlations change during market crises, and why diversifying across different sources of returns can be more effective than simply investing in multiple cryptocurrencies.
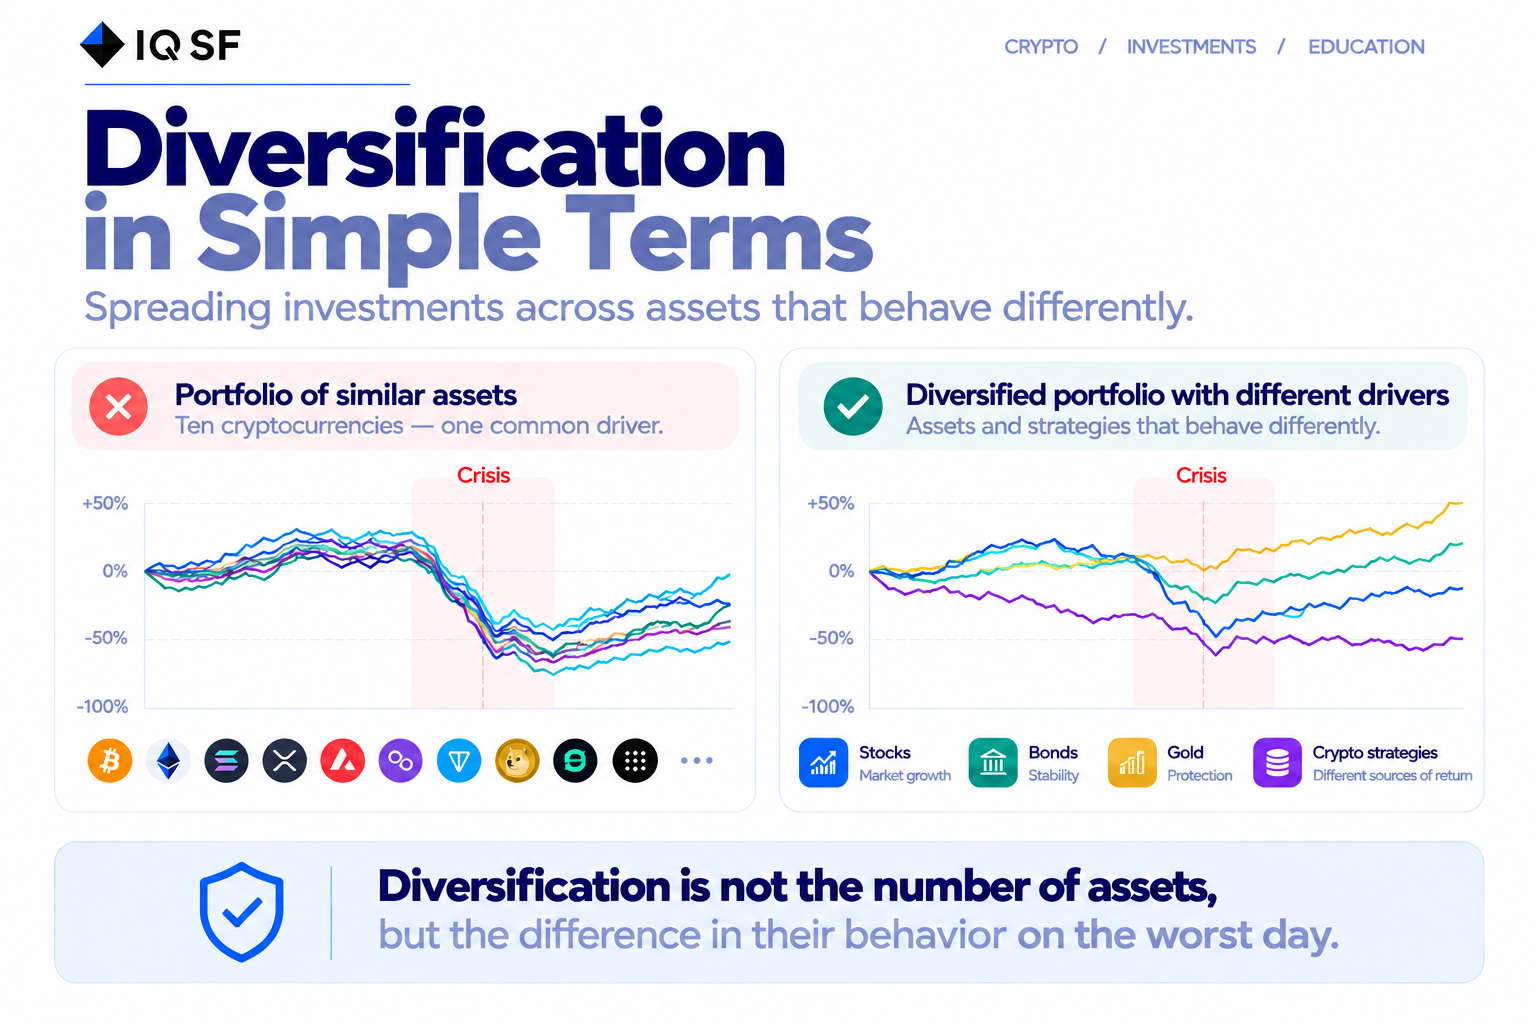
Diversification means spreading money across holdings that behave differently. The point is not the number of positions but the difference in their behaviour: if everything in a portfolio falls at once, there is no diversification, however many lines it contains.
Hence a rule that shortens half the conversations on this subject. Diversification is measured by behaviour on the worst day, not by the number of assets.
Below: how it works on a plain example, why quantity does not help, what genuinely differs, and how to test your own portfolio without complex maths.
How it works on a plain example
Picture two businesses in one town: selling umbrellas and selling ice cream. A rainy summer is a bad year for ice cream and a good one for umbrellas. A hot summer reverses it.
The owner of both earns less than the owner of the correctly guessed one, but earns every year. They traded part of the potential profit for predictability of outcome.
That is the entire idea. Diversification does not increase returns; it reduces dispersion. The price of calm is giving up the maximum result.
The same example also shows the condition under which the idea works. It works because the weather cannot be rainy and hot at the same time. The moment a factor appears that hits both businesses at once, a ban on street trading, say, the split stops helping. Both businesses turn out to be linked through a cause the owner never considered.
Why quantity does not help
The most common mistake looks like this: an investor buys ten different cryptocurrencies instead of one and considers the risk spread.
In calm periods those ten do behave differently. On a panic day they fall together, because they share one driver: the mood of the whole market. Ten positions with a shared driver are one position split across ten lines.
The same happens outside crypto. In 2022 equities and bonds, the classic risk spreading pair, fell together, because the cause was common to both: rising rates. The relationship between them was not imaginary; a stronger factor simply appeared and acted on both parts alike.
Both examples point the same way. The question is not “how many assets do I hold” but “what makes them move” and “what happens if that driver turns against all of them at once”.
Why relationships tighten precisely in a crisis
This property deserves separate attention, because it turns diversification into an illusion exactly when it is needed most.
In calm periods each asset’s price moves for its own reasons: news about a specific project, flows into a specific sector, local demand. There are many such reasons, they differ, and assets diverge.
In a panic there is only one reason left: participants need cash. People sell not what has fallen but what can be sold quickly. So everything falls at once, and the relationship between assets measured in a calm period stops describing reality.
The practical consequence: any allocation maths based on long run averages systematically overstates the degree of protection. A portfolio is assembled from calm period data and tested in a stressed one.
What genuinely differs
Asset classes. Equities, bonds, property, gold, digital assets. They differ, but they converge in crises more than anyone would like.
Currencies. Part of the risk is removed simply by holding savings in different currencies, because the drivers really are different.
Source of return. The least obvious and most useful level. Return from an asset rising and return from the difference between instruments are two distinct sources: the first needs a rising market, the second does not. A portfolio containing both survives a falling market differently from one containing only the first.
Timing of entry. Spreading purchases over time removes the risk of one unlucky day. A simple measure that costs nothing and requires no calculations.
Horizon. A one year holding and a ten year holding respond differently to the same event, because their exit conditions differ.
A portfolio of strategies rather than of assets
For an investor in digital assets, spreading across coins achieves little, because they share a driver. Spreading across ways of earning achieves more.
A directional strategy earns on growth. A neutral one earns on differences between instruments. A short horizon strategy and a long horizon one react differently to the same event.
The trap here is repeating the original mistake one level up. Five strategies built on one principle behave on a bad day like one strategy at five times the size. This is verified not by their descriptions but by their behaviour on specific bad days in the past.
What diversification does not do
Worth stating plainly, so nothing extra is expected of it.
It does not protect against a general market decline. If everything falls, the portfolio falls too, simply less than its worst component.
It does not increase returns. A portfolio’s average result is lower than its best component’s, and that is the price of the trade rather than a side effect.
It does not substitute for position size. Leverage applied to the whole portfolio at once cancels any degree of diversification.
It does not work retroactively. An allocation assembled after a fall protects against what has already happened.
How to check your own diversification
Take three or four of the worst market days of recent years and look at what each portfolio component did on those days. If all of them fell by roughly the same amount, the portfolio is one position, however it looks on paper.
It is a simple test, and it tells you more than any annual average: behaviour in the tail is exactly what the portfolio was assembled for.
The same method applies to someone else’s strategy or set of strategies. The figures are computed from operation history, available through a read only key that grants neither trading nor withdrawal rights. Our IQ Metrics service computes behaviour in specific periods from that export, which is more informative than an average annual result.
In short
Diversification means spreading across holdings with different drivers. The number of positions decides nothing by itself.
Relationships between assets tighten precisely in a crisis, so calculations based on averages overstate protection. Diversification is verified by behaviour on the worst day, not by composition on paper.
For digital assets, spreading across coins works poorly, while spreading across sources of return works better.
Not an individual investment recommendation. Past performance does not guarantee future returns.