Can AI write a trading strategy? What You get in two hours and what is missing
In this article, we’ll explore why AI can write trading code in just two hours but still fall short of creating a robust strategy, how to distinguish a genuine market edge from overfitting, and why forward testing, stress scenarios, and Monte Carlo simulations are essential before putting real capital at risk.
An AI model can write you working trading code in two hours. Working code and a working strategy are two different things, and almost everyone confuses them. The code runs, opens and closes positions, and draws an attractive equity curve on historical data. A strategy is that code plus what the code cannot contain by definition: evidence that the pattern exists outside the slice of history it was built on, and rules for the months when it stops working.
The test takes one minute. Ask whoever is showing you a generated strategy: on which period were the parameters selected, on which period was it validated, and do those two periods overlap. If the answer sounds like “I took three years of data and optimised the parameters”, you are not looking at a strategy, you are looking at a description of the past. Below is what actually happens in those two hours, and how long the part that does not happen in them really takes.
What an AI model genuinely does in two hours
Three things, quickly and well. It writes code without syntax errors. It implements any logic described in words: a moving average crossover, a channel breakout, mean reversion, a volatility filter. And it tunes parameters until the curve on the chosen period looks smooth.
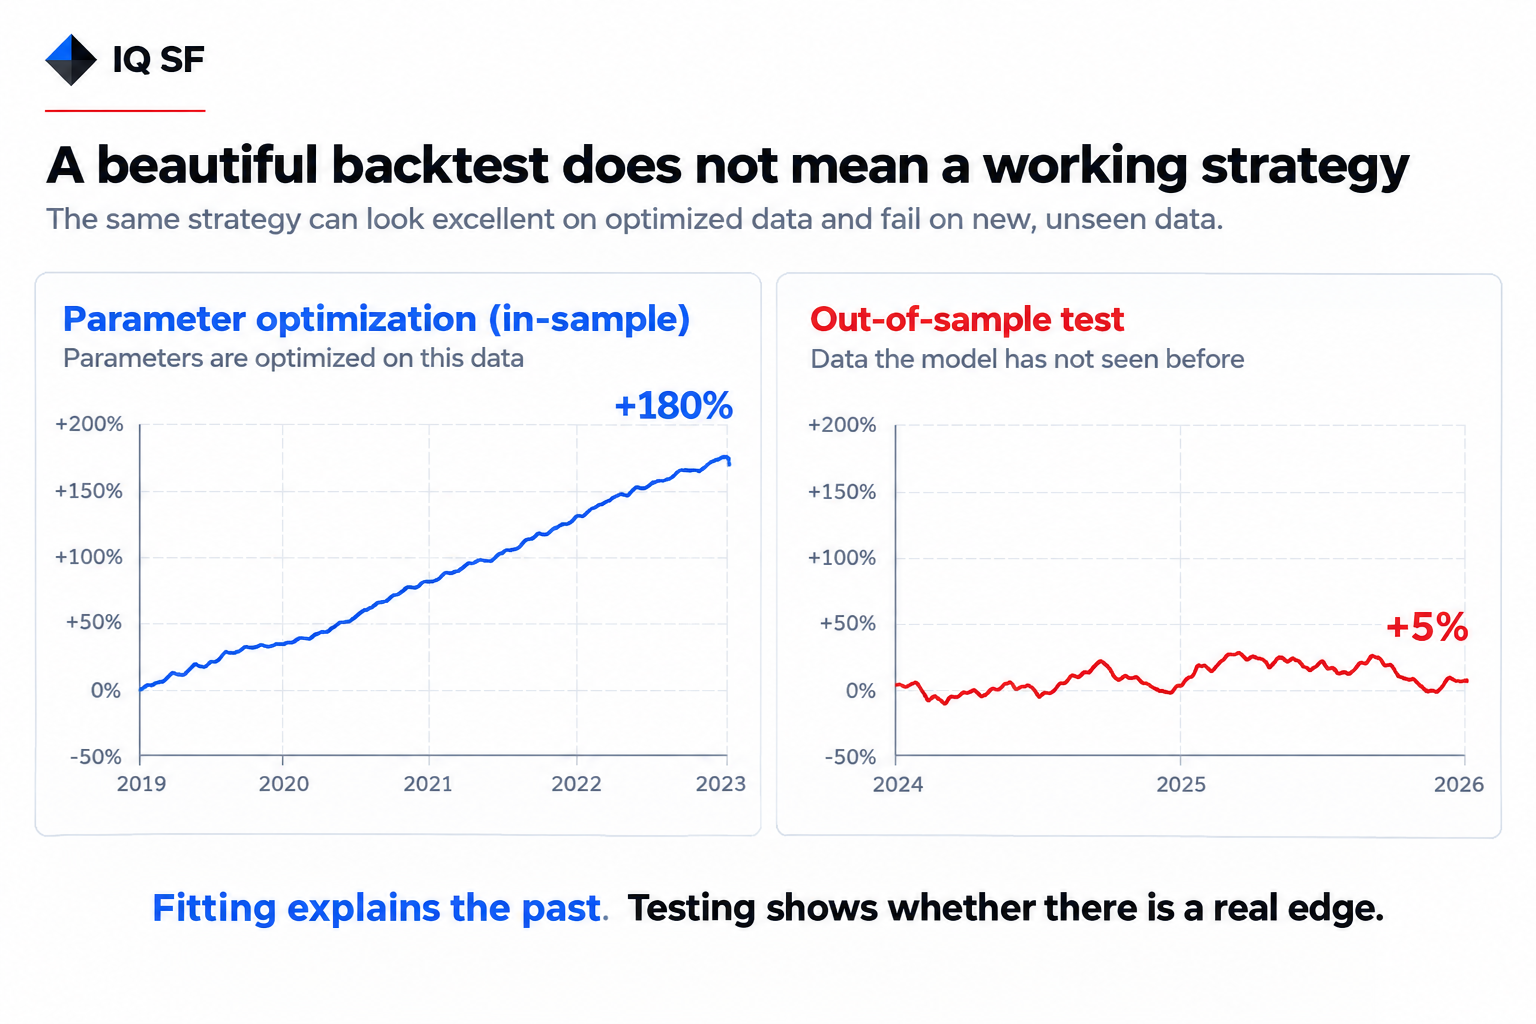
That last item is the trap. Fitting parameters to a specific slice of history is called optimisation, and a modern tool does it in seconds. That is precisely why the result looks beautiful: what you see is not a prediction, it is the best fit to something that has already happened. Such fitting used to take weeks, and the effort itself filtered out part of the self-deception. The barrier is gone now, and the time for doubt went with it.
What generated code cannot contain by definition
Data separation. A pattern must be validated on a period where it was not searched for. This is called forward testing, or walk forward analysis. If the history from 2019 to 2026 was used both for fitting and for validation, the result means nothing: you are measuring memory, not predictive power.
Execution costs. Commissions, slippage, funding rates on perpetual futures. On paper a strategy trading a hundred times a month can show 60 percent a year and turn negative once real costs are deducted. This is why our client reporting shows the net result: returns after commissions and execution costs, not a gross figure with footnotes attached later.
Behaviour across market regimes. Every system is good in one phase and poor in another. Trend following earns on directional moves and gives part of it back in a range. Mean reversion does the opposite. Code generated in two hours has usually been tested on one phase, and when the phase changes its author finds out from the account balance.
Stop rules. What to do when losses come in a row. Which drawdown counts as normal and which one means the pattern has broken. Without these rules the decision is made by a human in the moment, and a human in drawdown makes the worst decisions available.
Why a beautiful backtest proves nothing
Take a thousand random rule sets and run them on the same history. A few dozen will show an excellent result by probability alone. Pick the best one and you have a beautiful curve and zero grounds to expect it to repeat. This is the multiple comparisons problem, and it is cured neither by computing power nor by model quality.
Three standard checks separate a pattern from a fit. First: performance on data that took no part in the selection. Second: robustness to parameter shifts. If changing an indicator period from 20 to 22 halves the return, you have found a coincidence rather than a pattern. Third: does the principle work on other instruments and other markets. The momentum effect, which a significant part of our portfolio is built on, has been documented since the 1990s and confirmed on equities, commodity futures and currencies. A rule that lives on one pair in one year is not a pattern.
What is Monte Carlo simulation in trading, and why run history a thousand times
A historical equity curve is one path out of many possible ones. Trades happened in the order they happened, but the same set of trades in a different sequence would produce a different picture: the drawdown could be twice as deep simply because the losses clustered more tightly. From a single curve it is impossible to tell “the system works” from “the ordering was kind”.
Monte Carlo simulation solves exactly that. You take the set of actual trades or daily returns and rebuild alternative histories from it thousands or tens of thousands of times: a different order, a different sample with replacement, sometimes with noise added to costs and slippage. The output is not one number but a distribution of outcomes.
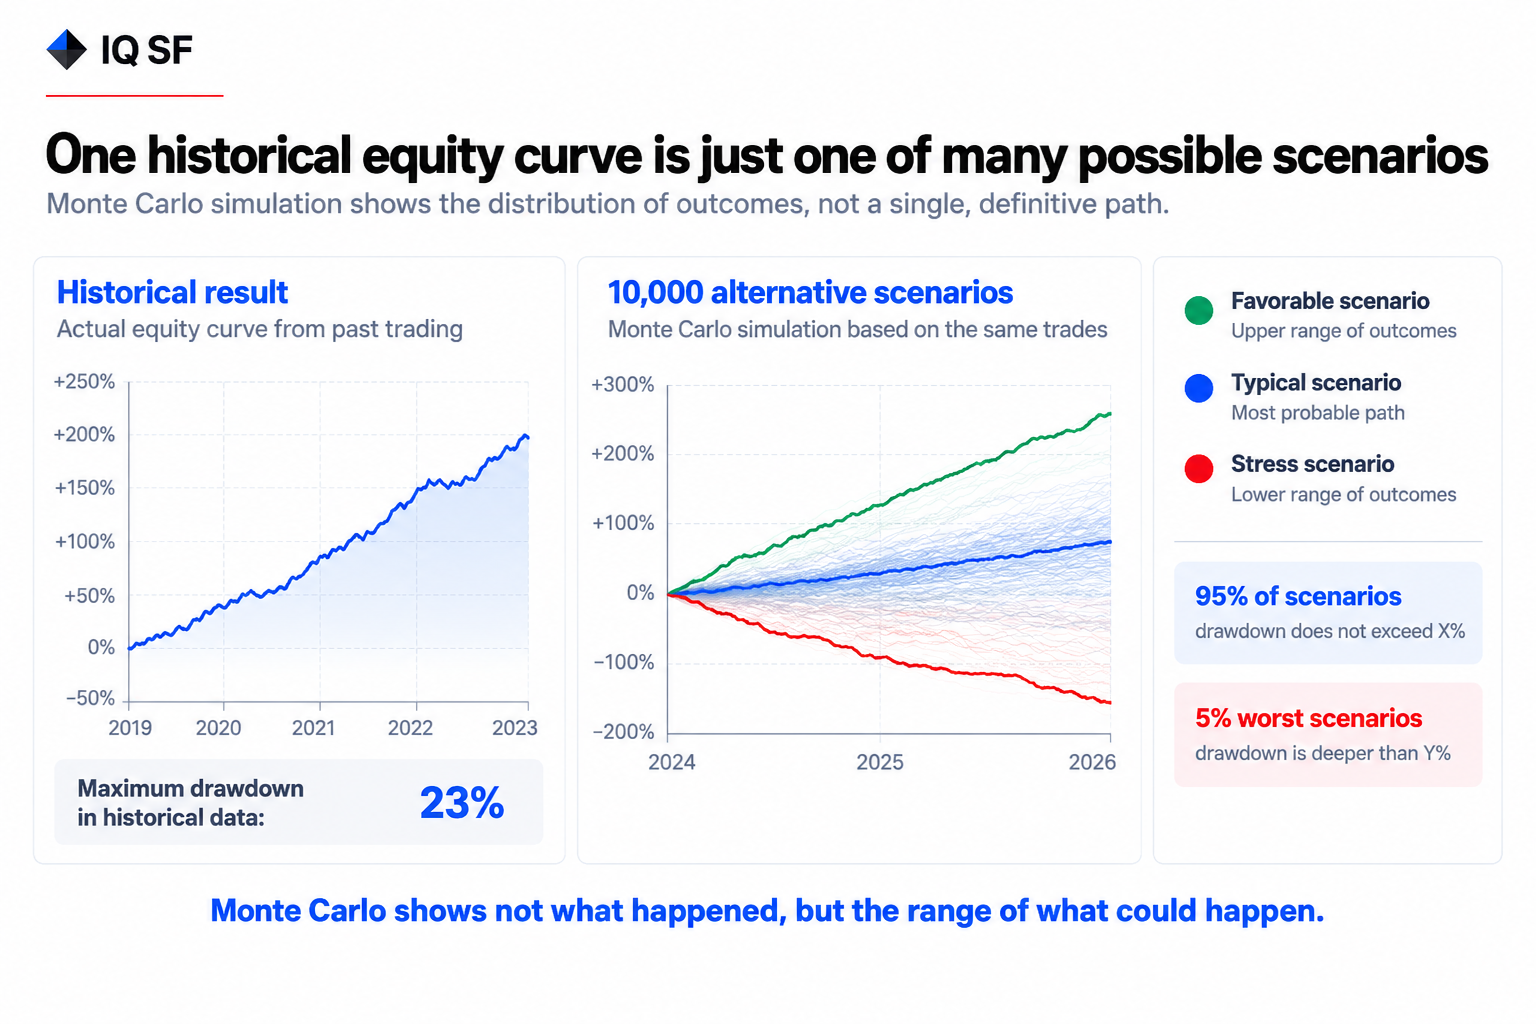
What the distribution tells you. Not “the maximum drawdown was 23 percent”, but “in 95 cases out of 100 the drawdown stays below this level, and in 5 cases out of 100 it reaches that one”. Not “80 percent a year”, but the range the result falls into with a given probability. Plus a separate figure: the probability of losing an unacceptable share of capital at the chosen position size, known as risk of ruin.
Stress scenarios are built the same way. On top of the reshuffling you add conditions that barely occurred in the history: costs twice as high, liquidity disappearing at the moment of exit, a losing streak twice as long as the worst one on record, a range market lasting twice as long. The point is not to predict a specific future but to answer one question: what combination of bad luck makes this construction unviable.
Our design maximum acceptable drawdown of 30 to 35 percent comes from exactly this process: actual history plus modelling of scenarios the market has not shown yet. The realised drawdown is smaller, and the gap between the two is the output of the stress modelling, not a rounding up.
What Monte Carlo does not do. It creates no new data: if the original sample is short or drawn from a single market phase, a thousand reshuffles add no knowledge, they only add confidence to a wrong conclusion. Simple trade reshuffling destroys autocorrelation and volatility clustering, which makes the result more optimistic than reality: in live trading losses arrive in runs, not evenly. And it does not model a regime that never appeared in the history unless that regime is added by hand as a separate scenario.
The practical takeaway for anyone being shown a strategy: ask not only “what was the maximum drawdown” but also “what drawdown is expected at the 95th percentile, and across how many simulation runs was that computed”. The first question is about the past, the second about what to prepare for.
How long building a trading strategy actually takes
Writing the code is the first two percent of the work. What follows cannot be accelerated: validation on non-overlapping periods, stress scenarios, capacity estimation, live testing with small size, and monitoring the divergence between actual fills and expected ones.
The core of our trading systems was built in 2012 for equity markets. In 2019 it was moved to digital assets, and continuous live trading has run since then, seven years and counting. The base components have not been rewritten in that time. This is not conservatism for its own sake: every rebuild aimed at the current market phase improves yesterday’s picture and degrades tomorrow’s.
Six signs that separate a system from a script
• There is a live money track record, not only a backtest, and the start date is known.
• The maximum drawdown and the recovery period are known, not just the return.
• Risk rules are written as numbers before the trade: capital at risk per trade, stop level.
• There is an answer to which market phase the system performs poorly in, given in advance rather than after the losses.
• Parameters were not adjusted to the last few months, and this can be verified against a change log.
• The result is reproducible independently, from exchange data, not from the author’s word.
Where AI is genuinely useful in systematic trading
It accelerates implementation and testing considerably. A hypothesis that used to take a day is now checked in an hour, and more variants fit into the same time. It writes the supporting layer well: data loading, metric calculation, report formatting.
What it does not do is carry responsibility for money. A tool bears no consequences for a decision and does not distinguish a pattern from a coincidence unless asked to in the right way. That responsibility stays with the human, and it is what separates a system that works for years from code that produced a pretty chart two hours ago.
FAQ
Can ChatGPT or another AI model create a profitable trading strategy? It can create code that implements a strategy and looks profitable on historical data. Profitability on history is not evidence of future profitability, because the parameters were fitted to that history. What makes a strategy profitable is validation on unseen data, realistic cost modelling and defined risk rules, and none of those come from the code generation step.
What is overfitting in trading, and how do you detect it? Overfitting is when a strategy captures the random specifics of one dataset instead of a repeatable market effect. Three checks detect it: performance on data excluded from the fitting process, stability when parameters are shifted slightly, and whether the same principle works on other instruments. A sharp drop in results under any of the three indicates fitting rather than an edge.
How many trades are needed before a track record means anything? Fewer than a hundred trades is early history, and quality is not yet a subject of discussion. Several hundred trades spread over more than a year is a reasonable basis. Distribution over time matters as much as the count: three hundred trades in one month and three hundred over three years carry very different evidential weight.
This material is for informational purposes only and does not constitute investment advice.
Frequently asked questions
Can ChatGPT write a profitable trading strategy?
It can write code that implements a strategy and produces an attractive equity curve on historical data, but that is not the same as a profitable strategy. The code's parameters were fitted to that exact history, so a good backtest alone says nothing about future performance. A strategy also needs validation on data excluded from fitting, realistic cost modelling and defined risk rules, none of which the code generation step provides.
What is overfitting in trading, and how can you spot it?
Overfitting means a strategy is tuned to the random noise of one historical dataset rather than to a repeatable market effect. Three checks reveal it: performance on data excluded from fitting, stability when a parameter is shifted slightly, for example moving an indicator period from 20 to 22, and whether the same principle holds on other instruments, such as the momentum effect documented since the 1990s.
What does Monte Carlo simulation show about a trading strategy?
Monte Carlo simulation reshuffles the same set of historical trades thousands of times to build a distribution of outcomes instead of one lucky curve. It shows, for example, the drawdown level unlikely to be exceeded in 95 cases out of 100, plus the probability of an unacceptable capital loss, known as risk of ruin. Our own design maximum acceptable drawdown of 30 to 35 percent was set using this process.
How long does it actually take to build a working trading system?
Writing the code is only the first small part of the work, roughly two percent of the total effort. What follows, validation on non overlapping periods, stress testing, capacity estimation and live testing with small size, cannot be accelerated. The core of our trading systems was built in 2012 for equity markets, moved to digital assets in 2019, and has been trading live continuously since then, seven years and counting.