Survivorship bias in trading: why a manager has ten strategies instead of one long track record

In this article, we’ll explore why multiple short strategy track records can create survivorship bias, how failed strategies disappear from presentations, and why investors should look at continuous history, drawdowns, and stress periods before trusting a manager’s performance.
Ten strategies with ten different launch dates are not a track record. They are a selection of survivors. Strategies that failed to survive stress do not appear in the presentation: they were closed, and new ones were launched instead, from a clean slate and with a beautiful chart starting from zero.
That is why, when evaluating a manager, you should look not at returns first, but at the launch date and the length of the continuous track record. Below, we explain where this effect comes from, why profitable strategies rarely live long, and which three questions can check whether the result is real in two minutes.
The metaphor here is precise: you are looking at a cemetery where only fresh tombstones are placed in the most visible spots. The strategy that existed in 2019 is not shown because it no longer exists.
This is called survivorship bias, and in capital management it can be the most expensive mistake of all.
What survivorship bias is: the bomber story
During World War II, mathematician Abraham Wald worked on the problem of reinforcing bomber aircraft. The military brought him data: diagrams of planes that had returned, with bullet holes marked on them. Most of the holes were in the wings and tail. Very few were near the engines and cockpit. The obvious conclusion seemed to be: add armor where there are more holes.
Wald suggested the opposite. The engines and cockpit needed reinforcement, precisely the areas where there were almost no holes. The reason was simple: planes hit in the engine did not return. They were not in the sample. The data did not show where planes were hit most often. It showed where a plane could be hit and still make it home.
A manager’s performance showcase works in exactly the same way. You only see the planes that returned.
Why profitable strategies rarely live long
High returns are almost always purchased with tail risk. As long as the market behaves normally, the strategy curve moves upward smoothly and beautifully. Then comes a day when normal behavior ends: an exchange freezes, liquidity disappears, or the price moves in one hour as far as it usually moves in a month.
On that day, it becomes clear that the strategy was not earning from an edge. It was selling insurance against disaster and keeping the premium. Disaster happens rarely, but when it happens, it takes everything at once.
A classic example from market history is Long-Term Capital Management. Two Nobel laureates among its partners, four years of impressive returns, and a reputation as the smartest team on Wall Street. Then came 1998, Russia’s default, and positions that were considered almost risk-free began moving together in the worst possible direction. The fund lost almost everything within a few weeks. Its model worked for a normal market, but it did not account for the fact that normality can end.
In crypto, the cycle is shorter, so these stories happen more often. A strategy that showed a smooth profit throughout 2021 meets May 2022 and stops existing. A strategy that worked perfectly in the summer of 2022 meets November and the collapse of a major exchange. Each time, the reason is described as external and unique. Each time, the track record is closed. Each time, a new one appears a month later.
Continuous strategy track record: what it shows that returns do not
One strategy that lives for many years answers a question that no return figure can answer: what happens to the strategy on a bad day.
A continuous curve contains everything. Drawdowns that were recovered. Periods when the market gave no opportunity to earn, and the task was simply not to lose. Days when Bitcoin fell by a third in a week, and the strategy did not break apart, but passed through it.
These parts of the chart are worth more than the steepest rise. A rise shows what the strategy can do in a good period. A drawdown shows whether it will survive until the next good period.
There is a simple thought experiment. Imagine two curves with the same final result over five years. The first one is continuous, with two serious drawdowns that the strategy recovered from. The second consists of four separate fifteen-month segments, with gaps between them.
The final result is the same, but the amount of information is completely different. The first curve showed you how it behaves under pressure, twice. The second told you nothing, because every time the moment of truth arrived, the track record ended and a new one began.
Company age and strategy age: where the substitution happens
There is a substitution here that is worth noticing.
A company may have existed for ten years. That does not mean the strategy whose results you are being shown has been running for ten years. A company can have a license, an office, an auditor, and forty employees, while trading a strategy that was launched four months ago.
The age of the legal entity and the age of the strategy itself are two different numbers. In presentations, they are often placed close to each other so that they are read as one.
The same substitution happens with assets under management. Three hundred million dollars under management sounds solid, but it says nothing about how that capital behaves in a crisis. Size is a result of sales, not proof of quality.
How to check a manager: three questions
Ask the manager three questions.
First: how many years has the exact strategy whose results you are showing been running continuously? Not the general approach, not the company, but the specific strategy with a specific launch date and a continuous curve.
Second: what happened to this strategy during market crashes? Ask for specific dates and specific drawdown depth. A good test is to name the date yourself and ask to see the exact section of the curve for that period.
Third: were there any strategies that you closed? The answer to this question says more than the entire presentation.
A manager with a real long track record will answer calmly and with numbers. There is nothing to hide. Drawdowns have already happened and have already been survived. More than that, such a manager will show you the worst months themselves, because they understand: this is their strongest argument, not a weakness.
A manager without a long track record will begin explaining why past results are not representative, why the market has changed, and why the new version of the strategy is fundamentally better than the old one. All of these statements may be true. The problem is that they cannot be verified, while a continuous curve can.
What to do if there is no long track record at all
Sometimes a manager honestly says: the strategy has been running for one year, and there is no long history yet. This is not an automatic rejection. It is a reason to change the evaluation criteria.
Look at whether that year included a stress period. A year of growth checks nothing. A year that includes a crash can check a lot, even over a short period.
Look at transparency: access to exchange reports, not screenshots in a presentation. The ability to see trades, not only the final equity curve.
Look at how risk is described. If the manager states the expected drawdown depth in advance and it later matches the actual result, that is a strong signal. If drawdown is described vaguely, you will only discover its real depth through experience.
And keep the investment size consistent with the length of the track record. One year of history is not a reason to allocate the same amount as you would to a strategy with a five-year continuous curve.
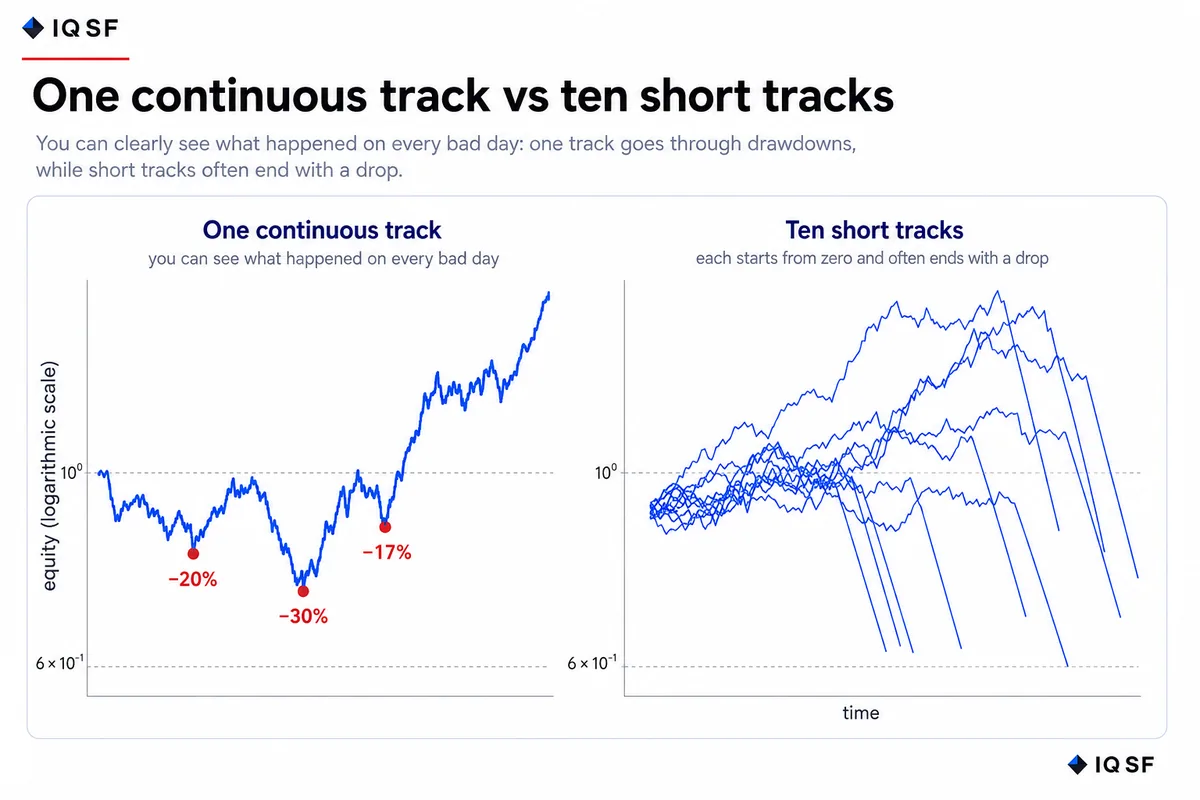
Chart 1. One continuous track record versus ten short ones: the information is in the drawdowns, not in the rises.
Frequently asked questions
What is survivorship bias in trading and where does it come from?
Survivorship bias happens when only strategies that survived stress are shown; failed ones are quietly closed and replaced with new ones starting from zero. The idea comes from WWII, when Abraham Wald studied bullet holes on returning bombers and argued for reinforcing the engines and cockpit, since planes hit there never made it back. A manager's showcase works the same way: you only see strategies that returned.
Why do profitable trading strategies often not last long?
Profitable strategies often do not last long because high returns are frequently bought with hidden tail risk: the curve moves up smoothly until normal market behavior ends. Long-Term Capital Management showed this pattern: two Nobel laureates among its partners, four years of impressive returns, then almost total loss within weeks after Russia's 1998 default. In crypto the cycle is shorter, so collapses happen more often.
What three questions reveal whether a manager's track record is real?
The first question is how many years the exact strategy being shown has run continuously with a specific launch date, not the company or general approach. The second is what happened to it during market crashes, asking for specific dates and drawdown depth. The third is whether the manager has closed any strategies before, since one with a real long track record answers calmly with numbers and shows the worst months.
Does a company's years in business prove the strategy has a long track record?
No, the age of the legal entity and the age of the specific strategy are two different numbers that presentations often place close together so they read as one. A company can exist for ten years, with a license and an auditor, while trading a strategy launched only four months ago. The same substitution happens with assets under management: three hundred million dollars sounds solid but says nothing about behavior in a crisis.