Crypto arbitrage: where the return comes from and where it disappears

In this article, we’ll explore how crypto arbitrage works, where price differences between exchanges come from, how trading fees, slippage, and execution speed erode profits, what risks remain even in market-neutral strategies, and how to evaluate real arbitrage returns by accounting for all costs and the total capital involved.
Crypto arbitrage means extracting return from a price difference for the same asset across venues or across forms. Buy where it is cheaper, sell where it is dearer, capture the spread. In theory the risk is close to zero, because both legs happen almost simultaneously.
In practice the return is almost entirely consumed by three things: costs, speed, and moving funds. Understanding exactly how they consume it is what separates a working strategy from an attractive idea.
Below: the main forms, the mechanics of how return disappears, the risks that remain once market risk is removed, and how to assess someone else’s arbitrage track record.
The main forms
Cross exchange. One asset trades at different prices on two venues. Buy on the first, sell on the second, keep the difference. The simplest form and the most awkward to execute: it requires capital pre positioned on both venues.
Spot versus futures. A futures contract usually trades above the underlying. Buying the asset while selling the future locks in that gap, which converges to zero by expiry. The return is known in advance, which makes the form popular.
Funding based. A variant of the above for perpetual contracts, where a recurring payment between sides of the market plays the role of convergence. The construction holds while the payment flows the right way and turns into an expense when it reverses.
Triangular. The difference appears within one venue across three pairs. A chain of three conversions returns slightly more of the starting currency. It lives for seconds and requires automation.
Where the return disappears
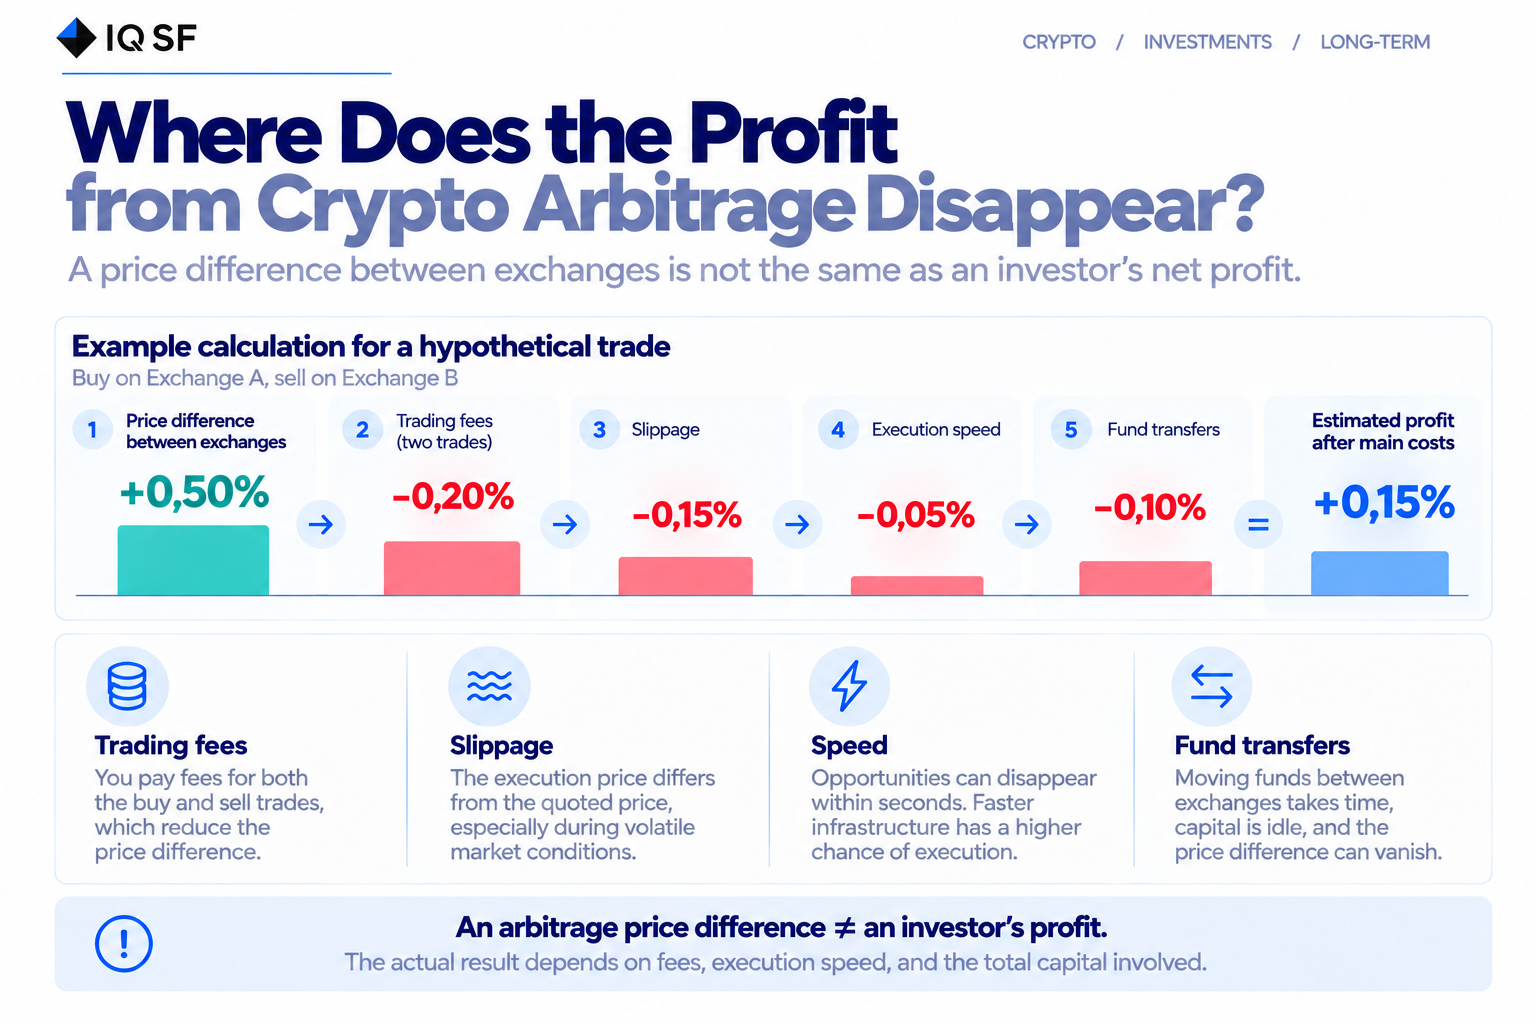
Fees. An arbitrage trade is always at least two operations, so fees are paid twice. A spread that looks like half a percent becomes a tenth of that after two taker fees, and nothing at all on a poor fill. Executing with limit orders lowers fees, but then the second leg is not guaranteed, and a neutral position becomes a directional one.
Slippage. The price on the book and the price of execution are different numbers. The gap grows with order size and with how fast the market is moving. Arbitrage opportunities appear precisely in fast moments, which is when the book is thin and slippage is at its worst. A calculation based on displayed prices overstates the result by exactly the cost of execution.
Speed. A visible price gap lives for seconds. Time passes between decision and execution, and the opportunity is gone. This is why arbitrage is almost entirely automated: it is a contest of infrastructure rather than analysis, won by whoever has the shortest path to the venue.
Moving funds. The classic cross exchange trap. You buy cheaply on one venue to sell dearly on another, but the asset has to be transferred, the transfer takes minutes or longer, and the gap has closed. The fix is to pre position capital on both venues, which means only half the money is working at any time.
That last point deserves separate attention, because it distorts not the trade result but the denominator. Returns computed on the working portion of capital are twice the returns on the invested amount. This is the most common implicit overstatement in arbitrage track records, and it is uncovered by a simple question about total capital committed.
What risks remain
The claim that arbitrage is riskless holds only for market risk, and even then not fully.
Execution risk. The first leg fills, the second does not, and instead of a neutral position you hold a directional one. This is not a rare malfunction but an ordinary consequence of using limit orders in a fast market.
Venue risk. Funds sit on several exchanges at once, and the quality of each becomes part of the strategy’s risk. A construction requiring four venues carries the risk of four venues.
Withdrawal risk. The ability to move funds can disappear at the worst possible moment, and for arbitrage that depends on transfers this stops the entire operation.
Compression risk. The more participants, the smaller the spread. Returns in arbitrage strategies shrink as competition grows, and that is a normal property rather than a failure. A two year old track record may describe conditions that no longer exist.
Funding reversal risk. For funding based constructions: the payment that was the source of income becomes an expense, and a position planned for months requires closing.
Why a smooth curve misleads
A smooth profit curve is more common in arbitrage than in directional strategies, and that is exactly why it is dangerous as an argument.
Smoothness reflects the frequency of small gains, not the absence of risk. Real risk in these constructions materialises rarely and all at once: an unclosed second leg, a halt on withdrawals at a venue, a funding reversal, a spread collapsing to zero.
Put differently, the distribution of outcomes has a very high share of profitable days and a long left tail. Metrics built on averages do not reveal that tail, which is why the share of profitable days in arbitrage carries almost no information about risk.
How to evaluate an arbitrage strategy
Trade count and average profit per trade. Answers what actually produces the result and whether it is repeatable.
Share of capital genuinely deployed versus committed. Funds parked on a second venue for readiness are still part of the invested amount.
Behaviour on days of sharp moves, rather than in an average month.
Full cost accounting, including funding, transfer fees and the cost of idle capital.
Number of venues holding funds simultaneously.
Year by year return dynamics. Spread compression over time is a normal process, and a strategy showing no decline requires an explanation.
All of this is computed from operation history, available through a read only key that can neither trade nor withdraw. Our IQ Metrics service computes these figures from that export itself.
In short
Arbitrage earns on price differences, and those differences are small by definition. The outcome is therefore decided by costs, speed, and how much capital idles for the sake of readiness, not by the idea itself.
A smooth curve in arbitrage does not mean low risk. It means risk arrives rarely and in full, rather than a little each day. The share of profitable days is the least informative metric available here.
Not an individual investment recommendation. Past performance does not guarantee future returns.