Why 98% of traders lose to the market – yet you still think you’ll be in the 2%

In this article, we’ll explore why 98% of active traders ultimately lose to the market, how cognitive biases and hidden costs quietly erode performance, and why believing you’ll be among the remaining 2% is often part of the problem rather than the solution.
There’s a number the industry doesn’t like to say out loud.
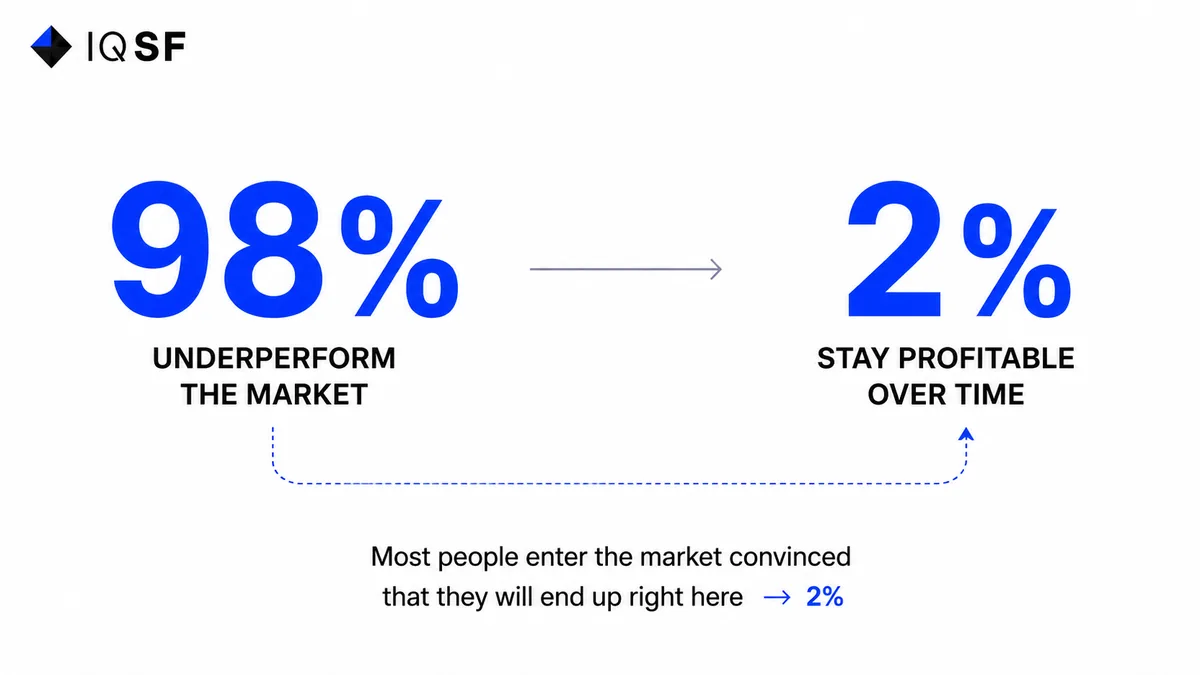
Over a multi-year horizon, no more than 2% of active traders remain consistently profitable. Ninety-eight out of every hundred lose. And almost every one of those ninety-eight sat down at their trading terminal convinced they would be among the two.
This isn’t about intelligence. Among the losing traders are engineers, doctors, and PhDs.
It’s about the structure of the game – and the structure of the human mind.
The numbers, without the sugarcoating
Retail trading statistics are brutal.
On average, only about 1.6% of traders remain consistently profitable each year. Over a one-year period, roughly 10% manage to preserve their capital or generate a profit. Over several years, only around 2% survive.
One of the most famous studies on this subject was conducted in Brazil’s futures market. Researchers tracked nearly 20,000 people actively day trading.
The result: 97% of those who traded for more than 300 days lost money. Only a handful out of thousands earned more than the equivalent of a minimum wage.
And this wasn’t a casino with a built-in house edge. It was a regular financial market.
A similar study in Taiwan found that retail traders, as a group, consistently lose about 3.8% of their annual trading volume, with most of that money flowing to institutional investors and foreign funds.
In other words, retail traders losing money isn’t an accident. It’s a structural transfer of capital from amateurs to professionals.
Meanwhile, algorithms already dominate the markets.
By various estimates, more than 70% of transactions in the U.S. stock market are executed by algorithms. In the foreign exchange market, estimates from the BIS suggest the figure can also approach 70%.
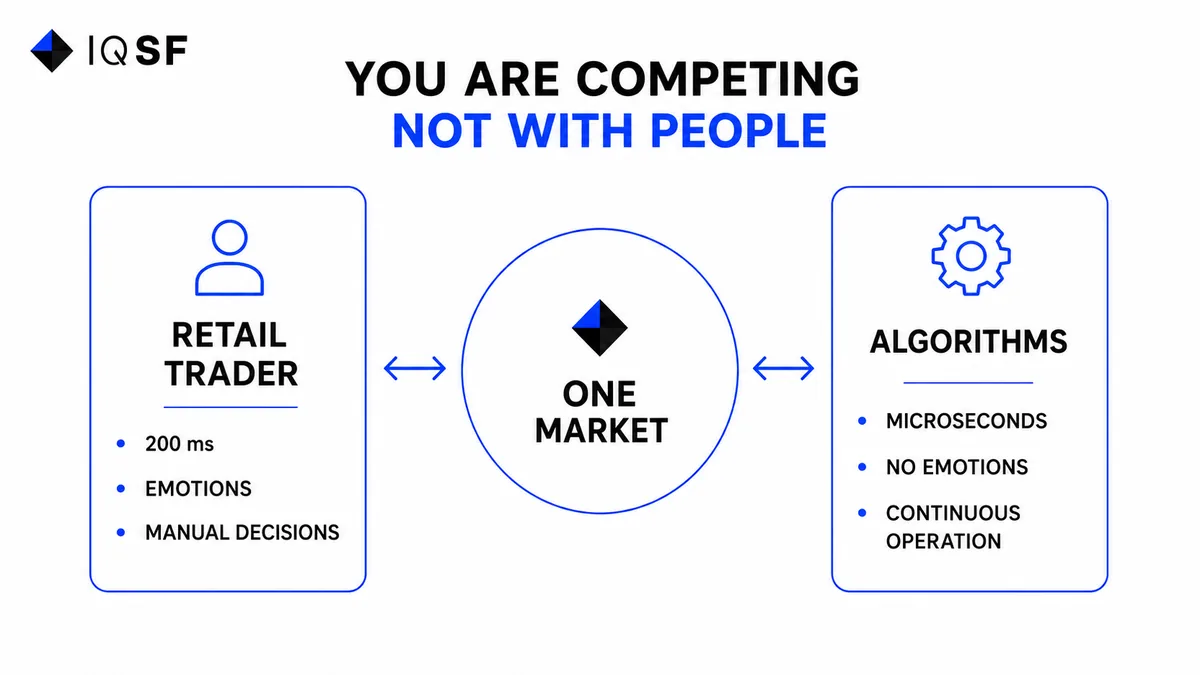
When a retail trader manually opens a position, there’s usually a machine on the other side – one that calculates faster, never gets tired, and never experiences fear.
To put this into perspective:
Human reaction time is roughly 200 milliseconds.
A trading algorithm reacts in microseconds – thousands of times faster.
This isn’t a case of “humans being slightly slower.” It’s an entirely different sport being played on the same field.
Why are You so sure You’ll be in the 2%?
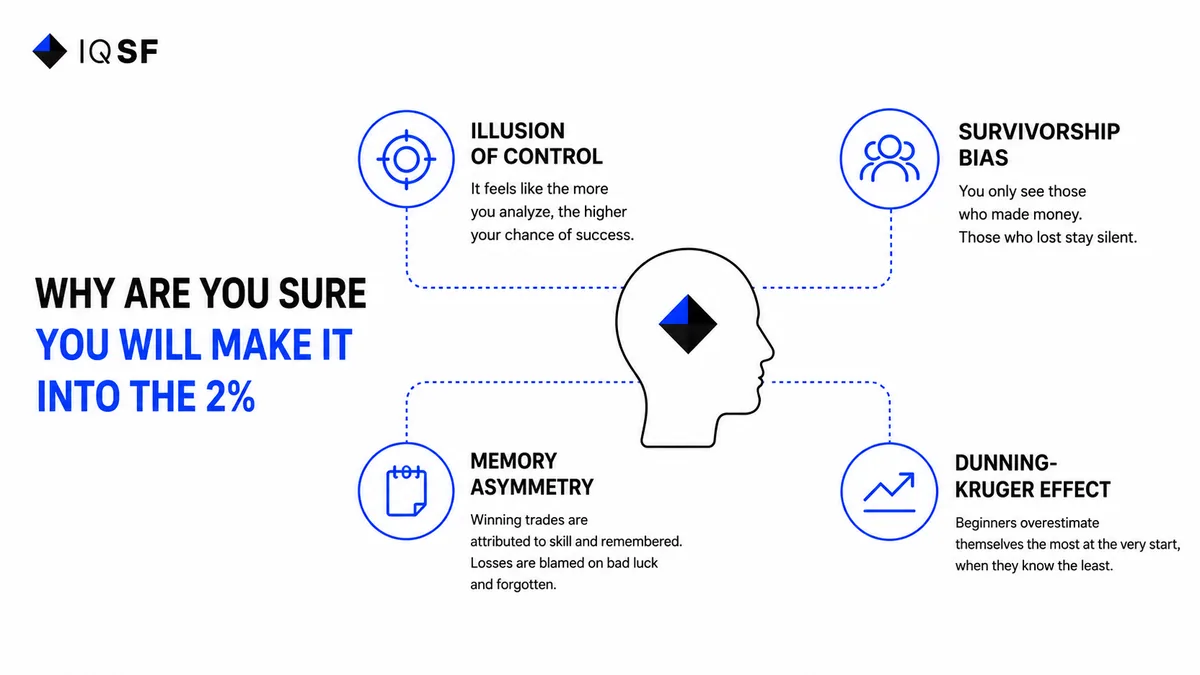
A combination of cognitive biases is at work here, and it’s universal.
The Illusion of Control
It feels intuitive to think that the more analysis you do, the higher your chances of success. Markets don’t work that way. More activity often means more commissions and more mistakes, not more profits. The Taiwanese study found that the most active traders actually lost the most money.
Survivorship bias in the information space
Your feed only shows the winners. Screenshots of massive gains. Success stories. Luxury watches. Those who blew up their accounts stay silent. The result is a distorted perception: it seems like everyone is making money except you, so surely you just need to work harder.
Memory asymmetry
People vividly remember their winning trades and attribute them to skill. Losing trades are blamed on bad luck and quickly forgotten. As a result, the statistics in our heads are always better than the statistics in reality.
The dunning-kruger effect
Beginners tend to overestimate themselves the most precisely when they know the least. An early lucky profit during a bull market reinforces the illusion: “I’ve figured out how this works.”
An aviation analogy
In aviation, there’s a distinction between procedural competence and heroic competence. A good pilot isn’t someone who brilliantly recovers from a dangerous stall. A good pilot is someone who never gets into that situation because they follow checklists and trust instruments over intuition. Retail traders almost always choose heroism. They trust feelings like, “I can sense the market is about to reverse,” more than they trust a system. And that feeling is exactly what destroys them. The 2% who survive are usually those who stop being heroes and become processes.
Where the Money Disappears: Four Leaks
If you break down a typical losing year for a retail trader, the losses almost never come from a single catastrophe.
They come from the same small leaks repeated over and over.
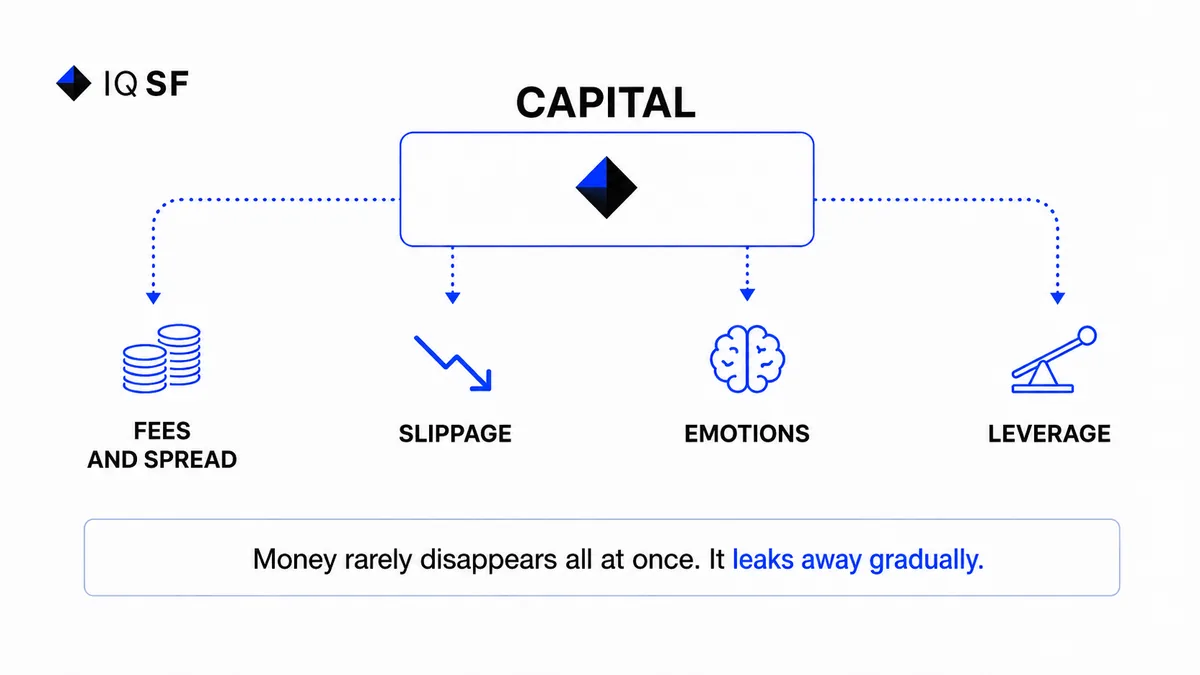
1. Commissions and Spreads
Every trade costs money. Active traders execute hundreds of trades.
Let’s do the math: At 50 trades per month and an average cost of 0.1% per trade in commissions and spreads, you may be giving away roughly 60% of your capital annually to market friction alone — before considering whether your market direction was right or wrong.
2. Slippage
The price you actually get is almost always slightly worse than the one you saw on your screen. For active traders, those tiny differences accumulate into meaningful percentages.
3. Emotional Trades
Chasing momentum after a sudden move. Cancelling a stop-loss. Doubling down on a losing position. Each of these behaviors has a statistically negative expectation.
4. Leverage
Leverage doesn’t only amplify profits. It amplifies losses and dramatically accelerates account destruction. At 10:1 leverage, a mere 10% move against your position can wipe out your account entirely. Most rapid account blowups are ultimately leverage stories. Put all four leaks together, and it becomes obvious why even traders who predict market direction more accurately than a coin flip still lose money. The market doesn’t need to destroy you overnight. It does it quietly, one small deduction at a time.
A Concrete Example: Why a 55% Win Rate Isn’t Enough
Let’s take an optimistic scenario.
You correctly predict market direction 55% of the time, which is already better than most traders.
However:
- Your average gain is +1%.
- Your average loss is -1.2% because you hold losers slightly longer.
- Trading friction costs 0.2% per trade.
Expected value per trade:
(0.55 × 0.8) − (0.45 × 1.4)
= 0.44 − 0.63
= -0.19% per trade
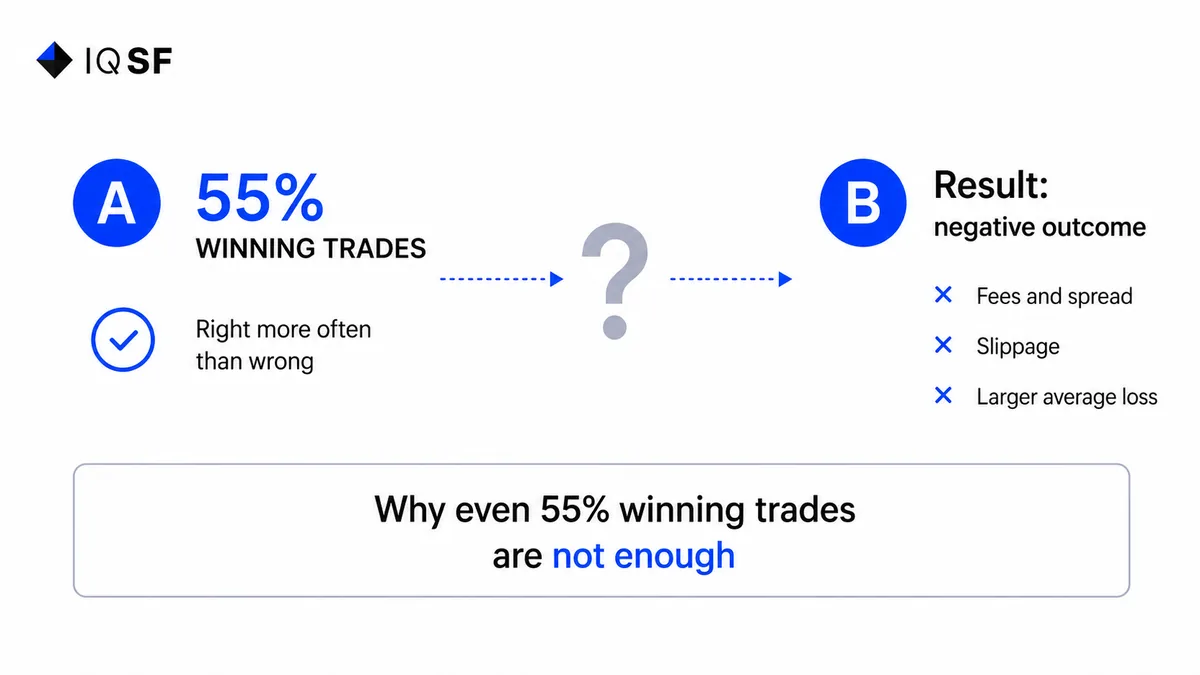
You are right more often than you’re wrong – and you’re still losing money.
That’s exactly how the market takes money from people who “read charts pretty well.”
What This Means in Practice
The conclusion isn’t that making money is impossible.
The conclusion is that making money through manual heroics is almost impossible — and the statistics confirm this year after year.
What actually works is something else.
Systematic Processes Instead of Inspiration
Establish predefined entry and exit rules that remain identical for every trade.
Risk Management First, Returns Second
First ask:
“How much am I willing to lose?”
Only then ask:
“How much do I want to earn?”
Delegate Where You Have No Edge
If there’s a robot on the other side of every trade, it’s reasonable to either build your own system or allocate capital to people who already have one.
The Core Idea
The belief that “I’ll be in the 2%” is not a plan.
It’s the very bias that pushes people into the 98%.
An honest beginning doesn’t start with self-belief. It starts with a cold acknowledgment: The market is structurally stacked against manual retail traders.
The winners are usually those who accept this reality and rebuild their approach accordingly.
At IQSF, we’ve been studying this side of the market since 2019: where money quietly leaks away and why.
If these data-driven analyses resonate with you more than social media success stories, join our Telegram community t.me/IQSF_Alpha – that’s exactly what we discuss there.
Frequently asked questions
What percentage of active traders are actually profitable in the long run?
No more than about 2% of active traders remain consistently profitable over a multi-year horizon. A Brazilian futures market study tracking nearly 20,000 day traders found that 97% of those who traded for more than 300 days lost money, and only a handful earned more than a minimum wage equivalent.
Why do most traders lose even when they predict market direction correctly more often than not?
Because trading costs and asymmetric gains and losses can turn a positive win rate into a negative expected value. In one example, a trader who is right 55% of the time, with average gains of 1%, average losses of 1.2%, and trading friction of 0.2% per trade, ends up with an expected value of about negative 0.19% per trade despite being right more often than wrong.
How much does trading frequency itself cost an active trader?
Roughly 60% of capital a year can go to commissions and spreads alone. At 50 trades per month and an average cost of 0.1% per trade, an active trader may give that much away to market friction before even considering whether the market direction was right or wrong.
Why are so many traders convinced they will be the exception who succeeds?
A combination of cognitive biases makes this belief feel reasonable even though the statistics contradict it. People remember their winning trades as skill while blaming losses on bad luck, social feeds show mostly winners while losers stay silent, and an early lucky profit during a rising market easily gets mistaken for proof of skill.