How to calculate recovery after a drawdown: why minus 50% requires a 100% gain

In this article, we’ll explore why recovering from a drawdown requires disproportionately higher growth, why a 50% loss needs a 100% gain to break even, and how investors can compare strategies by looking not only at drawdown depth, but also at recovery time and cycle return.
If an account falls by 50%, it needs a 100% gain, not a 50% gain, to return to the starting point. The reason is the base: the loss is calculated from a larger amount, while the recovery is calculated from a smaller one. If $1 million loses half of its value, it becomes $500,000. To become $1 million again, that $500,000 has to double.
The formula is simple: the required gain equals the drawdown divided by one minus the drawdown. This is the simplest math in investing and one of the least obvious things in practice. Below is a recovery table, an explanation of what this asymmetry does not imply, and a way to compare strategies without reducing everything to a single drawdown number.
Recovery table: how much you need to earn after each drawdown
A 10% drawdown requires an 11% gain. The difference is almost invisible.
A 20% drawdown requires a 25% gain. This already becomes noticeable.
A 33% drawdown requires almost 50%. The gap grows.
A 50% drawdown requires 100%. Twice as much as was lost.
A 70% drawdown requires 233%. This is already a different scale of problem.
An 80% drawdown requires 400%. This is no longer recovery — it is a new life from scratch.
The curve is not linear. Up to 20%, it behaves almost politely. After 50%, it turns almost vertically upward. That is why in capital management, the main task is not “to earn a lot,” but “not to end up on the right side of this chart.”
Why this feels wrong
Human intuition treats percentages as if they add up. Lose 20%, earn 20%, and you are back where you started. In reality, after minus 20% and plus 20%, you will still be 4% below the starting point.
Check it on a calculator: the effect is not obvious until you see the numbers. $1 million minus 20% is $800,000. $800,000 plus 20% is $960,000. You are still missing $40,000, even though the percentages were equal.
The same mechanism explains why volatility itself costs money. An account that moves +30%, -30%, +30%, -30% over four periods loses around 17%, even though the sum of the percentages is zero. A smoother account with a smaller amplitude will end up ahead, even with the same average result.
Why minimizing drawdown at any cost is a mistake
This is where the reasoning often breaks.
People often draw the following conclusion from the asymmetry: risk should be minimized at any cost. This is wrong, and here is why.
The asymmetry describes only one point of the curve: the lowest one. It says nothing about what happens next. A strategy with a 30% drawdown and an annual result of 80% goes through its trough and moves higher. A strategy with an 8% drawdown and a 10% result does not really go anywhere — it just slowly moves sideways.
You need to evaluate the full cycle: how much the strategy loses in a bad period, how much it earns in a good one, and how long it takes to return to the previous high. Three numbers instead of one.
Drawdown depth without recovery time and without cycle return means nothing. It is half a sentence cut off in the middle.
Two strategies with different drawdowns: which one is more efficient
Let’s take two strategies and look at them over three years.
The first strategy: maximum drawdown of 12%, average return of 15% per year. It looks calm and reliable. Over three years, capital will grow by roughly one and a half times.
The second strategy: maximum drawdown of 35%, average return of 55% per year. It looks frightening. Over three years, capital will grow almost fourfold.
By the single criterion of drawdown depth, the first strategy is three times better. By the result of the full cycle, the second strategy is more than twice as good.
The right answer to the question “which one is better” is this: it depends on whether you can stay in the strategy when the account shows minus 35%. If you can, the second strategy is objectively more efficient. If you cannot, the first one is better for you, because the realized result of a mediocre strategy is always higher than the unrealized result of an excellent one.
How to compare drawdowns between two strategies correctly
Comparing drawdown depth between two strategies is almost always incorrect unless three things are aligned.
First: the period. A strategy that operated only during a calm year will show a small drawdown simply because it never faced a crash. Comparing it with a strategy that went through a crisis is meaningless. It is like comparing two drivers by the number of accidents when one drives on an empty highway and the other on a mountain serpentine road.
Second: the risk level. The same strategy with different leverage produces different drawdowns, and that says nothing about its quality. A proper comparison is made either at the same risk level or through the ratio of return to drawdown, which is almost independent of the risk level.
Third: the measurement method. Drawdown can be calculated using daily account values, or it can be calculated using monthly data points. The second method systematically understates the result because it simply does not see what happened inside the month. For the same strategy, the difference between these two numbers can be twofold.
That is why, when speaking with a manager, you should clarify what data the drawdown was calculated from and over what period. The answer “around 15%” means nothing without these clarifications.
Return-to-drawdown ratio: how to calculate it and what benchmark to use
There is a simple metric that combines both sides: the ratio of annual return to maximum drawdown.
A strategy with a 20% return and a 40% drawdown gives a ratio of 0.5. A strategy with a 60% return and a 30% drawdown gives a ratio of 2.0. The second strategy is four times more efficient, even though its drawdown is deeper.
This is a rough metric, it has limitations, and professionals use more complex ones. But for a quick assessment, it is much more honest than talking only about the depth of the fall, because it forces both numbers to be stated at once.
The benchmark is simple: a value around one is a normal working level, above two is a good result, and below half means the risk is not paying off.
Time underwater: drawdown duration matters more than depth
In addition to drawdown depth, there is also drawdown duration, and it is often more important.
A 20% drawdown that lasts one month is easy to tolerate. The same 20% drawdown lasting fourteen months breaks most investors, because every month they receive a report where nothing has improved.
In professional evaluation, there is a separate metric for this: time underwater, meaning the period from the previous high to the return to that high. A strategy that spends an average of two months underwater and a strategy that spends nine months there are different products, even if their drawdown depth is the same.
When choosing a strategy, ask for both numbers: how deep and for how long. The second one is rarely mentioned voluntarily, because it looks less attractive.
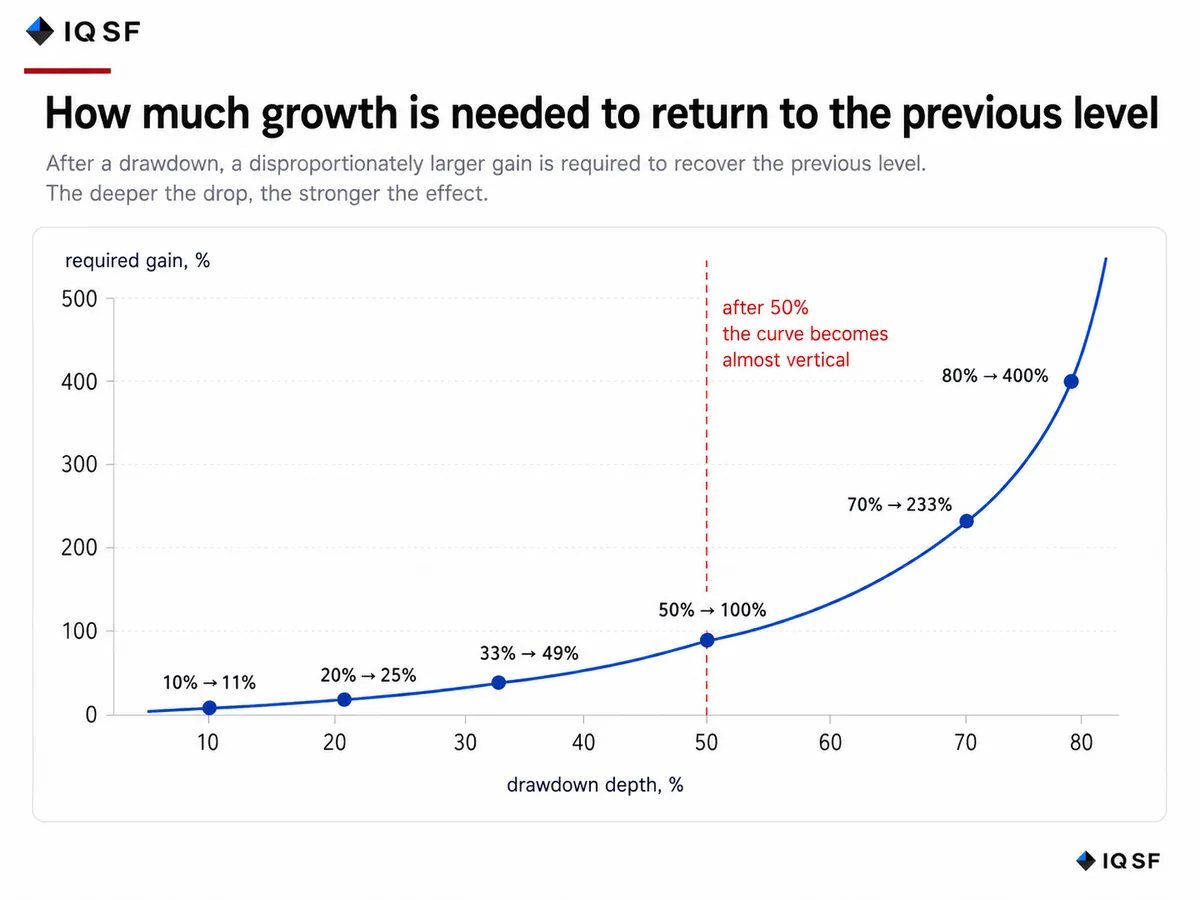
Chart 1. Recovery asymmetry: after 50%, the line becomes almost vertical
Frequently asked questions
Why does a 50% loss require a 100% gain to break even?
A 50% loss requires a 100% gain because the loss is calculated from the larger starting amount, while the recovery is calculated from the smaller amount left after the loss. If $1 million loses half its value it becomes $500,000, and that $500,000 has to double to reach $1 million again. The relationship becomes steep quickly: a 20% drawdown needs a 25% gain, while a 70% drawdown needs 233%.
Why doesn't losing 20% and then gaining 20% get you back to even?
Losing 20% and then gaining 20% leaves an account about 4% below where it started, because the gain is calculated on a smaller base than the loss was. On $1 million, a 20% loss leaves $800,000, and a 20% gain on that brings it to $960,000, still $40,000 short. The same mechanism means volatility itself costs money: an account moving +30%, -30%, +30%, -30% over four periods ends up down around 17%.
Is a smaller drawdown always the better strategy?
Not necessarily, because drawdown depth alone says nothing about how a strategy behaves afterward. A strategy with a 12% drawdown and 15% average annual return roughly grows capital one and a half times over three years, while one with a 35% drawdown and 55% return can grow capital almost fourfold. The better choice depends on whether an investor can stay invested through the deeper drawdown.
How do you fairly compare the drawdowns of two strategies?
Comparing drawdown depth alone is usually misleading unless the period, risk level, and measurement method match for both strategies. A strategy tested only in a calm year shows a smaller drawdown because it never faced a crash, and monthly data can understate the real figure by as much as twofold. A more useful measure is the ratio of annual return to maximum drawdown, where around one is normal and above two is good.
Why does drawdown duration matter as much as depth?
Drawdown duration matters because the same percentage loss feels very different depending on how long it lasts, and it is often more important than depth itself. A 20% drawdown lasting one month is easy to tolerate, while the same 20% lasting fourteen months wears down most investors, since every month brings a report showing no improvement. This is tracked separately as time underwater, the period from the previous high back to a new one.