When to stop a strategy: how to distinguish a normal drawdown from strategy degradation

In this article, we’ll explore how to distinguish a normal drawdown from genuine strategy degradation, which warning signs actually justify stopping a strategy, and why the decision should be based on data and model behavior rather than the size of the loss or emotions.
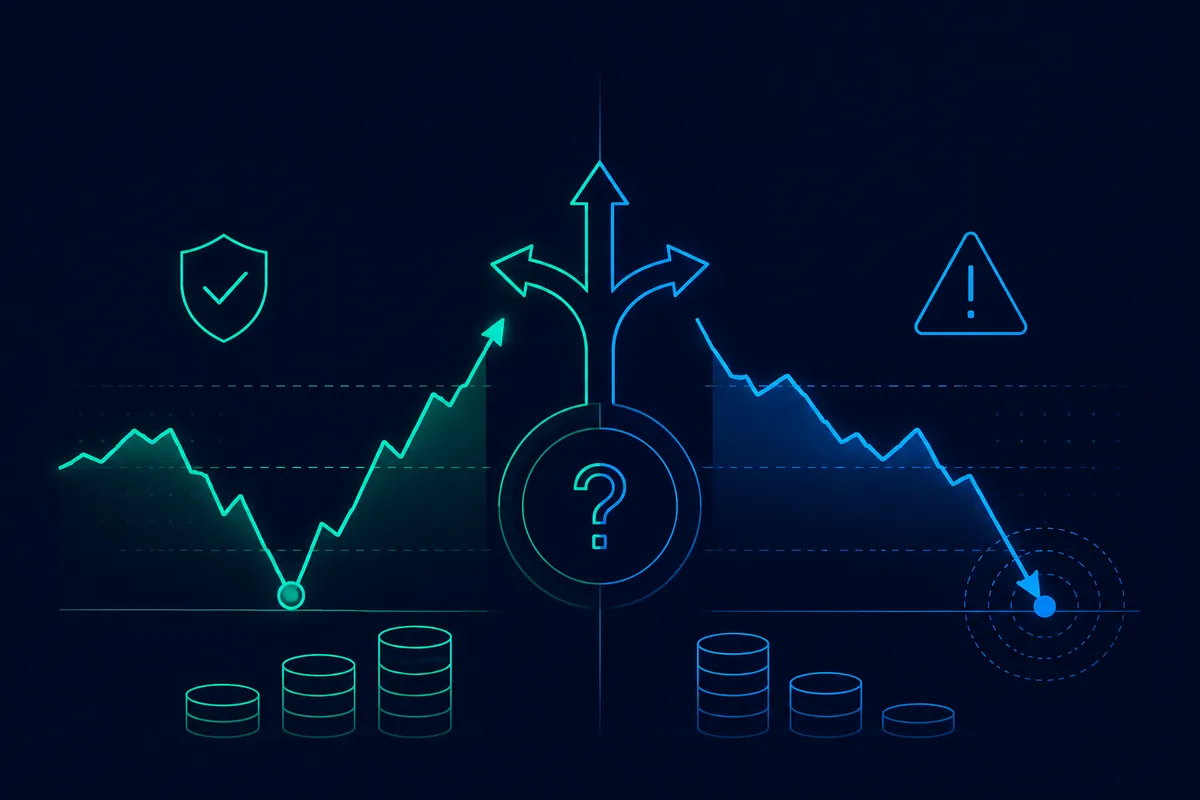
A strategy should not be stopped when the drawdown becomes painful. It should be stopped when it is no longer working as intended. These are two different events, and they do not always coincide: a deep drawdown with the mechanics functioning correctly can be normal, while a deviation from the model on a growing account is a reason for investigation.
Below are two sets of signs that help distinguish these situations, a separate look at the case when a strategy is making money for the wrong reasons, and an eight-question checklist that should be reviewed on a schedule, not based on emotions.
There are situations when a strategy does need to be stopped, and knowing how to distinguish them from a normal drawdown can be more valuable than any return figure.
The difference comes down to one question: is the strategy working as intended?
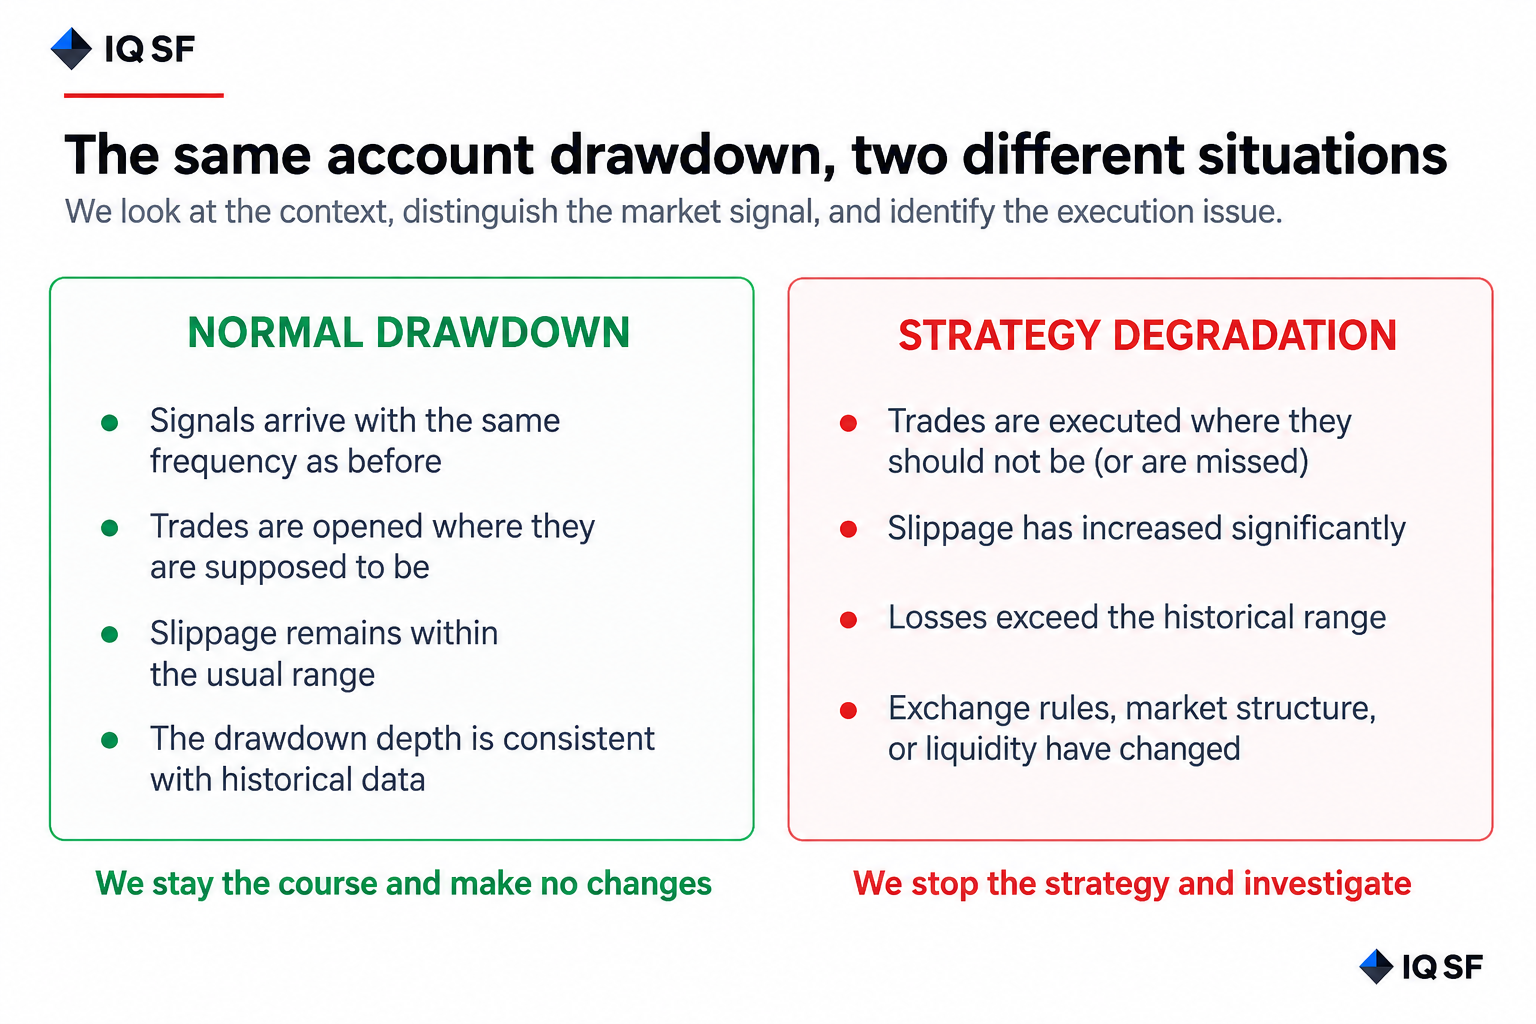
Signs of a normal drawdown
The entry logic continues to work as expected. Signals appear with the same frequency as before.
Stops are triggered where they should be. Position sizing follows the rules. Slippage remains within its normal range.
Losses are comparable in size to historical losses. The depth of the drawdown remains within the range already observed in the past.
The market is simply in an unfavorable regime for this particular approach. A trend-following strategy will lose money during a prolonged sideways market. This is not a failure. It is normal behavior in an unfavorable environment.
This type of drawdown should be allowed to run its course.
Signs of strategy degradation
Trading deviates from the model. Trades are opened where the rules say they should not be, or they are not opened where they should be. This may be caused by an execution error, a data failure, or manual intervention.
Execution has deteriorated significantly. Slippage has increased several times over, orders are no longer executed near calculated prices, or market liquidity has declined. A strategy designed for a certain level of market depth is no longer the same strategy when that depth disappears.
Losses move outside the historical range. Not simply "deeper than we would like," but deeper than anything observed across the entire verified history. This is a signal that reality has moved beyond the boundaries of the model.
The environment behind the strategy's edge has changed. The source of inefficiency has disappeared, the market structure has changed, or exchange rules and fees have changed. A strategy that profited from differences between venues may stop working when other participants begin exploiting the same opportunity faster.
In this situation, the strategy should be stopped and investigated, regardless of its current performance.
A special case: the strategy is profitable, but for the wrong reasons
The most deceptive situation looks like this: the account is profitable, but the profit is coming from somewhere it should not.
For example, suppose a strategy is designed to follow trends, but its entire quarterly result comes from several random trades in a sideways market, while its actual trend signals generated losses. Formally, everything looks fine. In reality, the model is not working and the result is accidental.
This can only be identified by analyzing the structure of profits, rather than looking at the final number. That is why every regular review should include one question: does the source of profit match the stated logic of the strategy?
If an account is profitable for reasons that no one can explain, that is just as much a reason for investigation as an unexplained loss. It is simply more pleasant, which is why it is more often ignored.
Why this should be checked against a list, not based on feelings
Your emotions will usually tell you the same thing: stop now, while it hurts. A checklist asks different questions, and those questions have factual answers.
The review takes about half an hour and requires data, not mood. If all the signs of normal operation are present, you are dealing with a normal drawdown, however unpleasant it may feel. If signs of degradation appear, the situation needs to be investigated immediately, even if the account is still profitable.
It is useful to conduct this review on a schedule rather than based on how you feel. Once a month, regardless of whether the account is rising or falling. This turns the checklist into a working tool rather than a last resort during a moment of panic.
Is there academic evidence behind trend-following strategies?
Momentum and trend-following approaches have a substantial academic foundation, not just a history of successful implementations.
The 1993 study by Jegadeesh and Titman demonstrated the persistence of the momentum effect in U.S. equities across decades of data: stocks that had performed best over the preceding months tended to continue outperforming in subsequent periods. The effect was statistically significant and could not be explained by known risk factors.
Later research, including a large body of work by AQR, confirmed the effect across different markets, asset classes, and time periods. Some studies trace it across more than a century of data and find evidence of momentum in commodities, currencies, and bonds, not just equities.
This is not a guarantee. It means that a drawdown in a trend-following strategy during an unfavorable period is not, by itself, evidence that the approach is dead. Similar periods have occurred many times before and have been followed by recoveries.
Moreover, well-known trend-following funds have experienced periods of weakness lasting several years. Investors who exited near the end of those periods often missed the subsequent recovery. This is another argument for relying on measurable criteria rather than feelings: three years without meaningful performance can be psychologically exhausting, but that alone does not prove that the underlying approach has stopped working.
This is the difference between patience and stubbornness: patience is based on measurable evidence, while stubbornness is based on hope.
Eight-question checklist before stopping a strategy
Before stopping a strategy, answer these eight questions.
Are signals arriving with the same frequency as before?
Do open trades follow the entry rules?
Are stops being triggered at the calculated levels?
Is slippage still within its historical range?
Is the current drawdown within the depth previously observed?
Does the source of profits and losses match the stated logic of the strategy?
Have any external conditions changed, such as fees, exchange rules, or market liquidity?
Has there been any manual intervention in the system?
Eight "yes" answers indicate a normal drawdown and support the decision to make no changes. Even one "no" means the situation should be investigated, and no new capital should be allocated to the strategy until the review is complete.
This is not individualized investment advice. Past performance does not guarantee future returns.
Frequently asked questions
When should you actually stop a trading strategy?
A strategy should be stopped when it is no longer working as intended, not simply when the drawdown becomes painful. Signs of a normal drawdown include entry logic still working as expected, stops triggering correctly, and losses comparable to historical ones, since the market may just be in an unfavorable regime. Genuine degradation looks different: trading deviates from the model, execution worsens, or losses move outside the historical range.
What does it mean if a strategy is profitable but for the wrong reasons?
It means the account shows a gain not coming from the sources the strategy is supposed to rely on, for example a trend-following strategy whose quarterly profit comes from a few random sideways trades while its actual trend signals lost money. Formally the result looks fine, but the model is not really working and the profit is accidental. This is caught only by checking whether the profit source matches the stated logic.
Is there research behind trend-following trading strategies?
Yes, momentum and trend-following approaches have a substantial academic foundation, not just a history of successful use. A 1993 study by Jegadeesh and Titman showed the momentum effect persisting in U.S. equities across decades of data, and later research, including work by AQR, confirmed it across markets and periods spanning more than a century. This is not a guarantee, but a drawdown alone is not evidence the approach has stopped working.
What checklist helps decide whether to stop a strategy?
An eight-question checklist covers signal frequency, whether trades follow entry rules, whether stops trigger at calculated levels, whether slippage and drawdown stay within historical ranges, whether profit and loss sources match the stated logic, whether external conditions changed, and whether there has been any manual intervention in the system. Eight yes answers point to a normal drawdown, while even one no means the situation should be investigated first.