Trading strategy backtest: why beautiful historical results do not repeat with real money
In this article, we’ll explore why beautiful backtest results often fail to repeat with real money, how curve-fitting, hidden costs, and survivor selection can distort historical performance, and what investors should check before trusting a strategy based only on past data.
A good backtest is not proof that a strategy works. It is proof that a combination of parameters was found that produced a good result on a specific segment of history. The entire difference between a working system and a fitted curve lies between these two statements.
Below are five ways to get an excellent backtest without having any real edge in the market, the signs of each one, and three questions that filter out most beautiful presentations. All five methods are not limited to fraud. Most often, they are honest mistakes that the strategy author does not notice.
Method one: fitting parameters to the period
Take any strategy with five adjustable parameters. Test twenty values for each one. That gives three million combinations. Among them, there will almost certainly be a dozen that show excellent results on your historical segment, even if the strategy idea itself contains no market edge at all.
This is a mathematical property of iteration, not a sign of quality. The more variants were tested, the more strongly the best one is adjusted to the random features of a specific dataset.
How to check. Ask how many combinations were tested before this one was selected. If the number is in the thousands, the result almost certainly contains a significant degree of curve-fitting.
What to look for in the numbers. A robust strategy has a smooth zone of effectiveness: neighboring settings produce similar results. If the system works perfectly with an indicator period of 14 and falls apart at 13 and 15, what was found is not a pattern, but a coincidence.
Method two: looking into the future
This is the most dangerous mistake because it appears unnoticed and produces phenomenal results.
Typical examples: the entry decision is made using the closing price of a bar, but execution happens at the opening price of the same bar. An indicator is calculated on the entire dataset at once, including future values. The list of traded instruments is built from those that performed well over the entire period.
It is also important to mention intraday modeling. Inside one bar, the actual order of events is unknown. If both the stop-loss and take-profit were touched within the same bar, the model should choose the worse scenario. Choosing the better one creates a systematic overstatement of results, which over time turns into fantasy.
How to check. Ask how the model handles a situation where the price touched both the stop and the target inside the same bar. The correct answer is: we assume the stop was triggered first. Any other answer means the result is overstated.
Method three: selecting only survivors
The test is run on instruments that exist today. Those that were delisted, went bankrupt, or went to zero are not included simply because they are no longer in the database.
In crypto, this effect is especially strong. Over any three-year period, dozens of coins disappear from circulation. A strategy tested on the current list automatically receives a sample of winners.
How to check. Ask whether the test includes instruments that were delisted during the period. An honest answer often sounds like this: no, we do not have data for them. That is normal, but it must be taken into account when evaluating the result.
Method four: ignoring costs
Commission, slippage, and funding. Each of these three small details may look insignificant on its own. Together, they can reverse the result.
A strategy that makes forty trades per month pays commission eighty times: once on entry and once on exit. At a 0.05% fee rate, that is 4% of the deposit per month only in commissions, and on leveraged volume the effect is multiplied. Add slippage of one or two tenths of a percent per trade, and half of the stated return disappears.
Funding on perpetual futures is charged every eight hours, and over longer holding periods it becomes a meaningful cost item.
How to check. Ask what commission rate is included in the calculation and whether slippage is included. If the answer contains zero costs or a commission rate below the real exchange rate, the result should be discounted.
Method five: testing only on a convenient period
A strategy tested on 2023 and 2024 has not really been tested. It has not faced a prolonged decline, a liquidity collapse, or a trading halt.
This is not an abstraction. The same configuration can show a confident profit on a sample from the last two years and completely lose the account on a sample that includes a bear market. The difference is not in the quality of the strategy. The difference is that the second sample contains a market regime that was absent from the first.
How to check. Name specific market crash dates and ask to see the strategy’s behavior exactly on those days. If the testing period does not cover them, no stress test was performed.
The main check: splitting the sample
Everything listed above comes down to one procedure that catches most problems at once.
The data is split into two parts. On the first part, the strategy is tuned: parameters are selected, instruments are chosen, and rules are defined. The second part is not seen by the model at all. After the tuning is completed and frozen, the strategy is run on the second part.
The gap between the results is the measure of curve-fitting.
How do you read the result?
| What happened | What it means |
|---|---|
| On the validation sample, the result is lower, but still in the same range | Normal, the strategy most likely has a real edge |
| On the validation sample, the result is twice as low | Warning sign: a significant part of the result may come from curve-fitting |
| On the training sample, the result is excellent, but on the validation sample it is around zero or negative | No real edge, the strategy is fitted to noise |
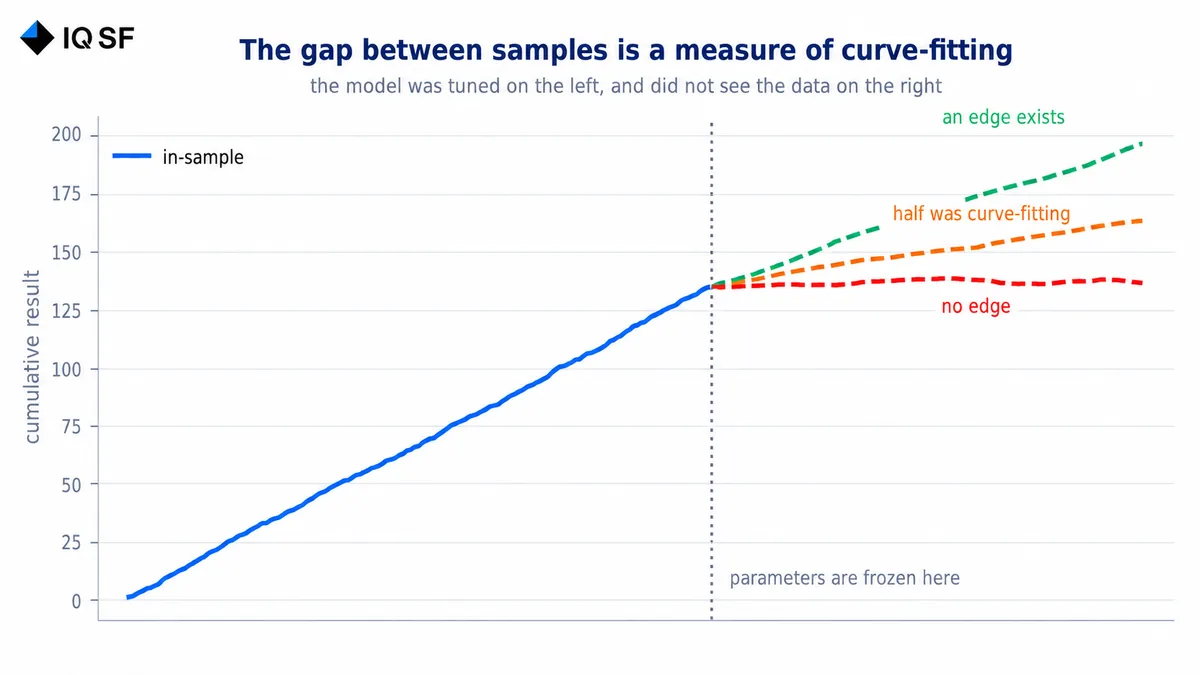
Chart 1. The gap between the training sample and the validation sample is the measure of curve-fitting.
This procedure is called out-of-sample testing. Its absence is the main sign that you are not looking at a tested strategy, but at a beautifully packaged parameter search.
Three questions for any backtest
First: which period was used to select the parameters, and which period was used to validate them? If the answer is “all available data,” there was no out-of-sample check.
Second: what costs are included? You need specific numbers for commission and slippage, not just the words “costs are included.”
Third: what happened to the strategy on market crash days? You should name the dates, not the manager.
These three answers take five minutes and filter out most materials that look convincing.
Why even an honest backtest does not guarantee the future
Even if all five traps are avoided, one fundamental limitation remains: a backtest shows how the strategy would have behaved in the past, assuming its execution had been ideal.
In reality, there are things that the model does not include. Execution delays. Exchange failure at peak load. Changes in platform rules. Liquidity leaving the instrument. None of these factors is necessarily fatal on its own, but together they explain why live performance is almost always more modest than model performance.
The practical consequence is simple: it is reasonable to expect real returns to be lower than the backtest and to plan accordingly. If the strategy remains attractive even with results twice as weak as calculated, it may be workable. If its attractiveness depends entirely on the model numbers, there is no margin of safety.
What investors should do
A backtest is necessary, but not sufficient. It answers the question of whether the idea has any basis at all. It does not answer the question of whether a specific live account will work.
That is why the weight of the backtest in the decision should be lower than the weight of the live track record. One year of real trading contains more information than five years of historical simulation, even if the historical numbers look better. Live performance includes everything the model does not see.
The shortest rule is this: if a strategy has only a backtest and no live track record, it is not a strategy yet. It is a hypothesis. The hypothesis may be correct, but the size of the allocation should match that status.
Frequently asked questions
Why doesn't a good backtest prove a strategy actually works?
A good backtest only proves that a combination of parameters produced a good result on one segment of history, not that the strategy has a real edge. Testing five adjustable parameters across twenty values each creates three million combinations, and a handful will look excellent on a given segment purely by chance. A robust strategy instead shows a smooth zone where neighboring settings produce similar results.
What is lookahead bias in a trading backtest?
Lookahead bias happens when a backtest uses information that would not have been available at the time of the trade, for example deciding on a bar's closing price but executing at that bar's opening price. It also appears when an indicator is calculated across the full dataset at once, including future values. If a stop-loss and take-profit are both touched within the same bar, a correct backtest must assume the worse outcome happened first.
How much do trading costs really affect a strategy's backtested return?
Trading costs can reverse a backtested result even though commission, slippage, and funding each look small individually. A strategy making forty trades a month pays commission eighty times, and at a 0.05% rate that alone is 4% of the deposit per month, while slippage of one or two tenths of a percent per trade can erase half the stated return. Funding on perpetual futures, charged every eight hours, adds further cost over time.
What is out-of-sample testing and why does it matter?
Out-of-sample testing splits historical data into two parts: the strategy is tuned on the first, then run unchanged on the second, which the model never saw. The gap between the two results measures how much performance came from curve-fitting rather than a real edge, and a result near zero on the validation part means the strategy was fitted to noise. Its absence is the main sign of a packaged parameter search.