Losing streaks in trading: how many consecutive losses are normal and when should you start worrying?
In this article, we’ll explore why losing streaks are a normal part of a trading strategy, how to assess their statistical probability, and when a series of losses actually becomes a reason for concern.
A strategy has produced five losing trades in a row. The first thought is: it has stopped working.
In most cases, that conclusion is wrong, and it takes only a minute to prove it on paper.
What is the probability of five or eight losses in a row?
If a strategy wins 50% of the time, the probability of five consecutive losses at any specific point is about 3%. That sounds rare.
But a year does not contain five trades. It may contain several hundred. Over a sequence of 200 trades, a streak of five consecutive losses is almost inevitable, with a probability above 95%. A streak of eight losses over the same number of trades occurs roughly once every three years.
In other words, an event that feels like a catastrophe and a reason to stop everything is statistically a normal part of the strategy’s operation. At some point, it is expected to happen.
For a strategy with a 40% win rate, the picture is even more severe. Over 200 trades, a streak of eight losses occurs in roughly three out of four years, while streaks of ten or twelve losses appear regularly over a multi-year horizon.
It is important to understand that this is not about strategy quality. It is about the properties of random sequences. If you flip a coin 200 times, a streak of seven heads in a row will appear in roughly half of all sequences, and no one would conclude that the coin has stopped working.
Why a losing streak feels like a strategy failure
People are not naturally good at feeling probabilities. They are good at seeing stories.
Five losses in a row do not feel random. They feel like a narrative: things were going well, then something changed, and now everything is going badly. The brain automatically looks for a cause because finding a cause feels easier than accepting randomness.
A well-known experiment illustrates this mechanism. People are asked to invent a sequence of 100 coin flips from memory. The sequences they create almost always contain too few long streaks because people instinctively alternate heads and tails. A sequence of six identical outcomes feels unrealistic. Real random sequences, however, contain such streaks naturally.
The same thing happens with trading results. A real equity curve contains periods that look like something has broken even when they are statistically normal. An invented equity curve usually does not. That is one reason fabricated performance reports often look suspiciously smooth.
How much does stopping a strategy after a losing streak cost?
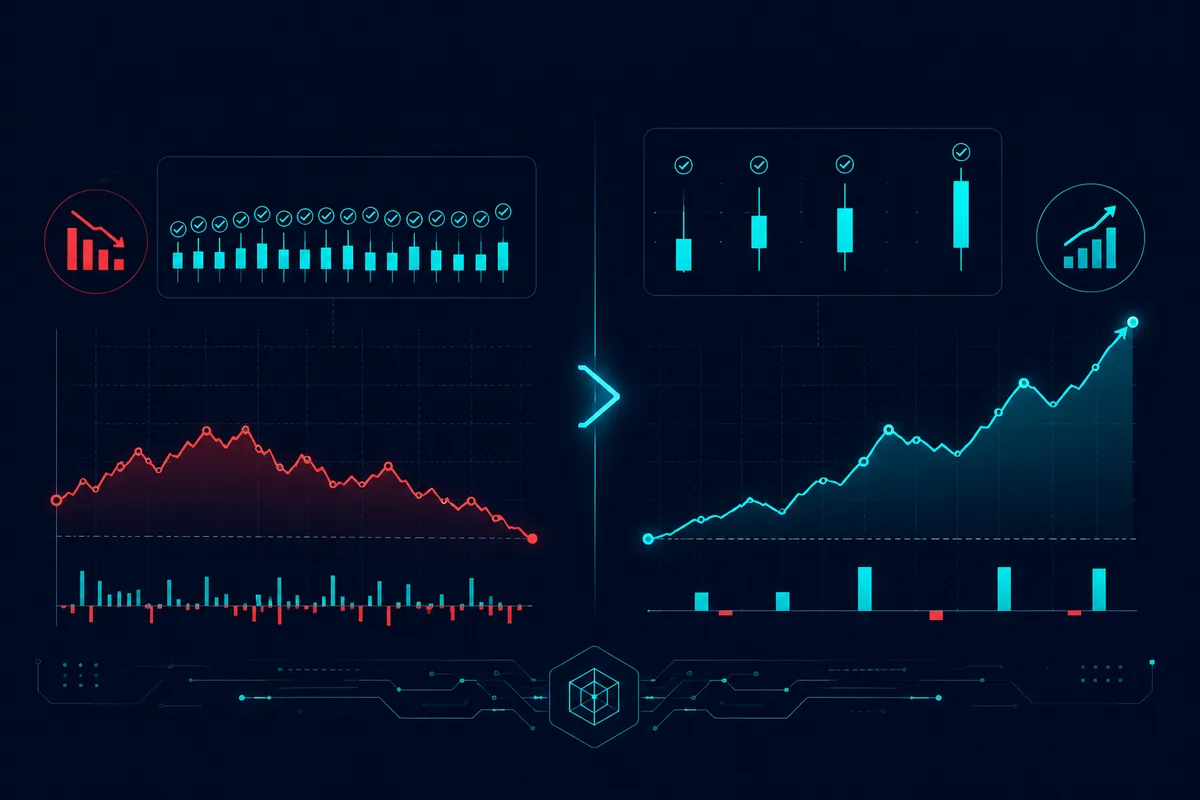
This leads to decisions that appear reasonable but can be expensive: stop the strategy after a losing streak, wait until it recovers, then restart it once the equity curve is rising again.
The result is a systematic pattern of selling your own edge near the bottom and buying it back near the top.
Consider a simple example. A strategy returns 60% over a year but experiences three losing streaks during that period. Each time, the investor stops the strategy for a month, waits for “stabilization,” and returns only after the equity curve starts rising again.
Three missed months represent one quarter of the year. But those missed months may include exactly the periods when most of the strategy’s returns are generated, so the loss can be much greater than one quarter of the annual result. In this scenario, a 60% return may be reduced to around 30%. At the same time, the investor still experienced the drawdowns in full because the strategy was stopped only after the losses had already occurred.
This is the most expensive form of caution: paying the full price of risk without receiving its potential compensation.
How many trades are needed to evaluate a strategy?
At least several hundred trades, and they should cover different market regimes. A rising market, a falling market, and a period when the market goes nowhere.
A strategy tested only during a bull market has not really been tested. It simply has not yet encountered the conditions that might break it.
A full market cycle matters more than the raw number of trades. Two hundred trades in a single market regime may provide less information than one hundred trades spanning a trend, a crash, and a sideways market.
It is also important to check whether the strategy has been overfitted to historical data. One simple warning sign is that performance deteriorates sharply after a small change in parameters. If a strategy works extremely well with an indicator period of 14 but falls apart at 13 and 15, the model may have captured a coincidence in a particular dataset rather than a genuine pattern.
A robust strategy usually has a broader zone of stability, where neighboring parameter values produce similar results. This suggests that the underlying effect is real rather than the product of parameter optimization.
What to do instead of stopping the strategy
If a losing streak is not automatically a reason to stop, what should you actually do?
First, determine whether the streak is within the historical norm. To do that, you need to know the longest losing streak across the strategy’s entire verified history. This number should be known before investing, not discovered after the losses begin.
Second, check execution. Do not focus on the result itself. Check the mechanics: are signals being generated correctly, are orders being executed near expected prices, and has slippage increased? A losing streak with normal execution and a losing streak caused by broken execution may look identical from the outside, but they are completely different events.
Third, look at the market regime. If the strategy is trend-following and the market has spent three months in a narrow range, a losing streak may be expected behavior rather than a surprise.
Fourth, do not change the parameters. The temptation to adjust the strategy after a losing streak is enormous, and doing so often leads directly to overfitting recent data. A strategy whose parameters are changed after every bad streak stops being a strategy and becomes a collection of reactions to the past.
Overfitting historical data: how to distinguish an edge from coincidence
Another problem with small samples is related to how strategies are developed.
If you test a thousand different parameter combinations on the same dataset, the best one will almost certainly show impressive results. But much of that performance may come from the search process itself rather than from a genuine edge. The more variations you test, the more likely the winning version is to be fitted to random features of that particular historical period.
There is a straightforward way to test this: divide the data into two parts, develop and optimize the strategy on the first part, then evaluate it on the second part, which the strategy has never seen before. The difference between these two results provides an indication of how much overfitting may be present.
A good sign is when performance on unseen data is lower but remains within the same general range. A bad sign is when the strategy performs exceptionally well on the development sample but falls to around zero or becomes unprofitable on the validation sample.
That is why, when evaluating any strategy, it is worth asking not only “What are the results?” but also “What data were these results obtained from, and was the strategy tested on data that were not used during optimization?” The second question eliminates a significant number of attractive presentations.
A practical rule for investors
Decide in advance how many consecutive losses would cause you to start asking questions, and make that number realistic.
If the longest losing streak in the strategy’s history is nine trades, then six consecutive losses are not a reason for concern. Twelve losses in a row are already a reason to investigate, but the investigation should be based on a checklist of degradation signs, not on emotion.
The number should be written down before the strategy starts. If you decide on it during the losing streak, the threshold will almost always become the current number of losses plus one.
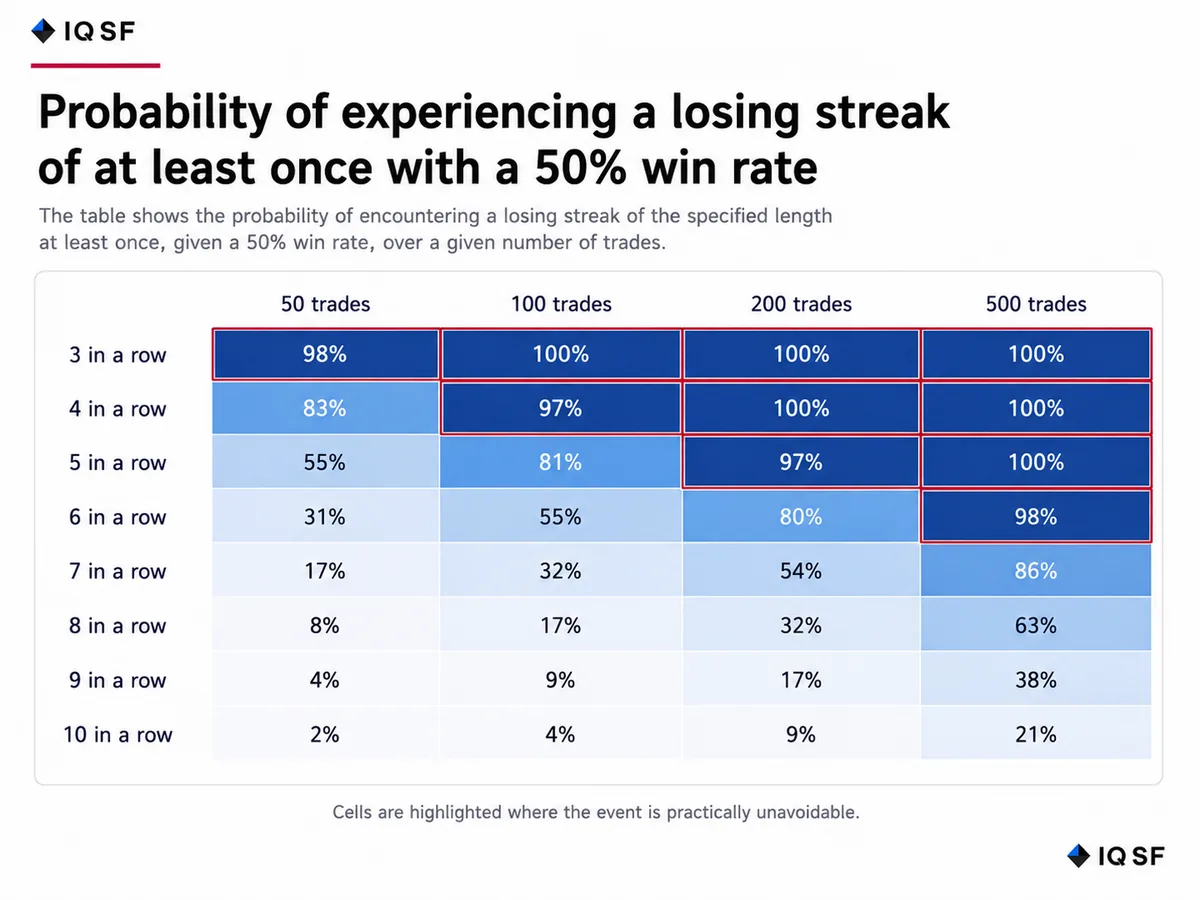
Chart 1. Probability of experiencing a losing streak at least once. Highlighted cells indicate outcomes that are practically inevitable.
Frequently asked questions
Is a losing streak of five or more trades in a row a sign that a strategy has stopped working?
Not by itself. If a strategy wins half its trades, a streak of five consecutive losses is almost certain to occur over a sequence of 200 trades, with a probability above 95%, since such streaks are a normal property of random sequences rather than evidence that the strategy is broken. An eight-trade losing streak under the same conditions occurs roughly once every three years.
Why does a losing streak feel like proof that something is wrong, even when it isn't?
Because people are naturally better at seeing stories than at judging probabilities, so a run of losses feels like a narrative of decline rather than a random event. When asked to invent a random-looking sequence from memory, people instinctively avoid long streaks because they feel unrealistic, even though real random sequences produce them naturally, which is one reason fabricated performance reports often look suspiciously smooth.
How much can it cost to stop a strategy after a losing streak and restart it later?
It can cut returns roughly in half in a typical scenario. If a strategy returns 60% over a year but an investor stops it for a month after each of three losing streaks and restarts only once the equity curve is rising again, the missed months can include exactly when most of the gains occur, reducing the annual result to around 30% while the investor still absorbed the drawdowns in full.
How should an investor decide whether a losing streak is normal or a warning sign?
By comparing it to the longest losing streak in the strategy's full verified history, a number that should be known before investing rather than discovered after losses begin. It is also worth checking execution mechanics, such as whether signals and order fills behaved normally, and the market regime, since a trend-following strategy is expected to lose during a prolonged sideways market.