Win rate in trading: why 40% profitable trades can be better than 70%

In this article, we’ll explore why win rate alone does not determine profitability, how a strategy with 40% winning trades can outperform one with 70%, and what investors should look at instead: average win, average loss, expectancy, and losing streaks.
There is one number that sells better than all the others because it is easy to understand without explanation: the percentage of profitable trades.
Seventy percent sounds convincing. Forty percent sounds like failure. In reality, these numbers have no direct connection to the final result, because they describe how often you are right, not how much money you make from being right.
Example calculation: two strategies with different win rates
Strategy A wins in 70 out of 100 cases. The average winning trade is 1%, and the average losing trade is 3%, because losing positions are held in the hope of a reversal.
The result: 70 multiplied by 1 minus 30 multiplied by 3 equals minus 20%. The strategy is right most of the time and still loses money.
Strategy B wins in 40 out of 100 cases. The average winning trade is 5%, and the average losing trade is 1.5%, because losses are cut quickly and without debate.
The result: 40 multiplied by 5 minus 60 multiplied by 1.5 equals plus 110%. The strategy is wrong more often than it is right and still earns confidently.
The difference is not in the quality of the forecast. The difference is in what happens after the forecast is made.
How a high win rate is achieved: three methods and their price
A high percentage of winning trades does not appear by itself. It is usually achieved in one of three ways, and all three have a price.
The first method is to move the stop far away and place the target close. Then almost every trade manages to reach the target before it reaches the stop. The win rate becomes 80% or higher. The price is that rare stop-loss events eat the profit from dozens of successful trades.
The second method is to use no stop at all and close positions only in profit. Then the win rate approaches 100%, because losing trades formally do not exist. But the loss does not disappear. It simply remains in an open position and does not enter the statistics. Such reporting is technically honest and completely meaningless.
The third method is to average down a losing position until the average price converges with the market. Every series ends in profit, the win rate looks excellent, and the risk accumulates in the position size. This structure can work for years and end in a single day when the move lasts longer than the available capital.
That is why a high win rate is not an achievement by itself. It is the result of choosing the relationship between the target and the stop, and that relationship should be examined separately.
Why a low win rate is psychologically harder
Strategy B will have series of five, six, or eight losing trades in a row. This is normal with a 40% win rate, it happens regularly, and it does not mean anything by itself.
But emotionally, it is hard to tolerate. These are exactly the moments when the investor wants to interfere: skip a signal, reduce size, change parameters. And almost always, the trade that gets skipped is the one that pays for the entire losing series.
A well-known effect is at work here: people value avoiding a loss about twice as strongly as receiving an equivalent gain. Eight small losses feel heavier than one large profit that covers them, even though the arithmetic says the opposite.
The practical conclusion for the investor is simple: a low-win-rate strategy requires not only trust in the numbers, but also a decision made in advance not to interfere. Otherwise, you will receive all of its losses and miss its main profits.
Why a losing streak does not mean the edge is gone
There is a common feeling that a strategy has a reserve of luck that gets used up during losing streaks. After five losses, it feels like luck should now turn around, or, on the contrary, that luck has run out.
Neither is true. Each new trade does not remember the previous ones. An edge is not a reserve. It is a property of the distribution: over a large number of repetitions, the sum tends to move in your favor, and losing streaks are a necessary part of that distribution, not a deviation from it.
An analogy from another field: a casino has a mathematical edge of roughly two percent in roulette. This does not prevent individual players from winning entire evenings in a row. The casino does not get nervous and does not change the rules after a bad evening, because it knows that the edge materializes over volume, not in every individual episode.
An investor who stops a strategy after a losing streak behaves like a casino that would close after one player had a lucky evening.
What to look at instead of win rate
The ratio of average win to average loss. This is what turns the frequency of being right into money. A value above two with a 40% win rate already produces a sustainable positive result.
Expectancy per trade. One number that accounts for both frequency and size: win rate multiplied by average win minus loss rate multiplied by average loss. If this number is positive, the strategy makes money, regardless of what the win rate looks like.
The maximum historical losing streak. This tells you in advance what you will have to tolerate, so you do not make that decision for the first time when it is already happening.
The exit profile: where the stop is placed, where the target is placed, and whether the stop is moved to breakeven. This answers the question of how the win rate was achieved, and therefore what price was paid for it.
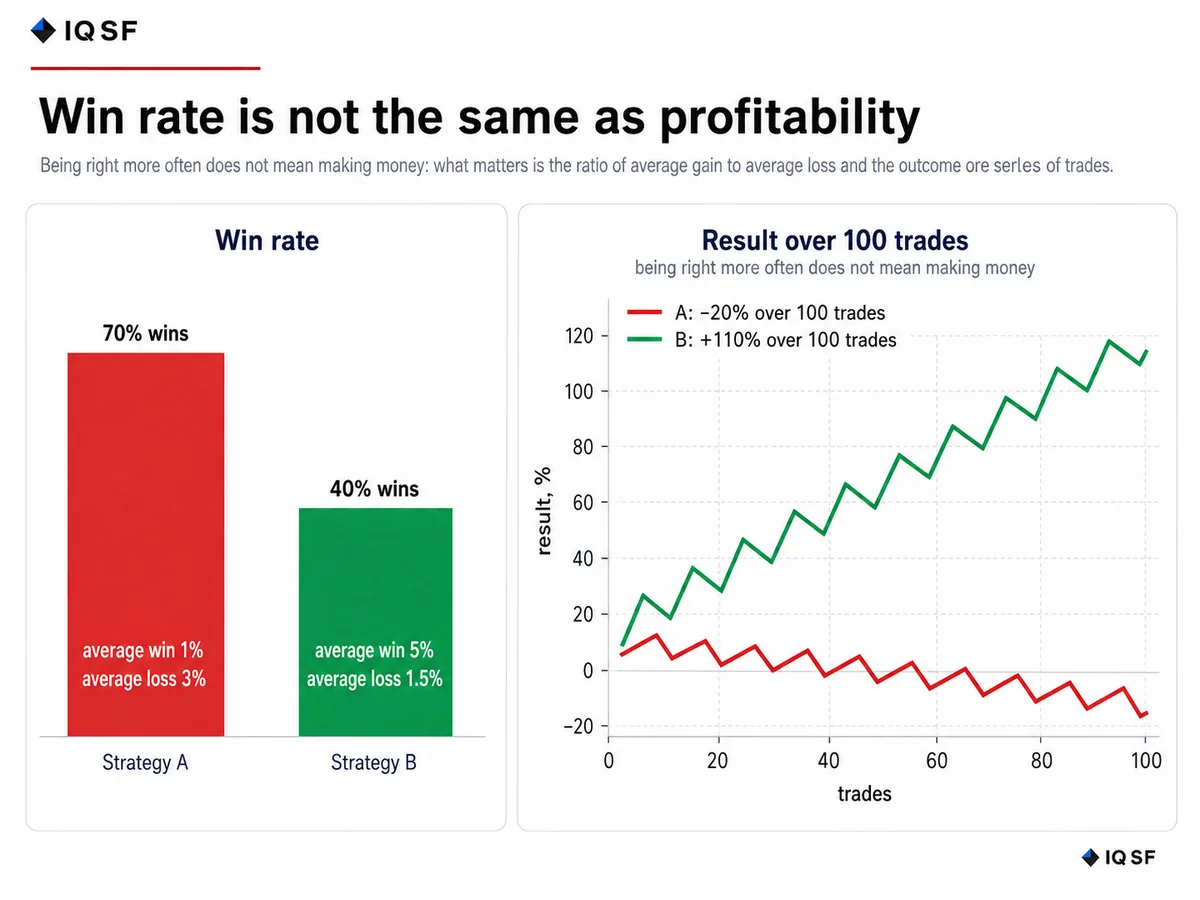
Chart 1. A high win rate with a falling curve versus a low win rate with a rising one.
Frequently asked questions
Can a strategy with a 70% win rate still lose money?
Yes, a strategy that wins 70 out of 100 trades can still lose money if its average winning trade is only 1% while its average losing trade is 3%, since 70 times 1 minus 30 times 3 equals minus 20%. A strategy that wins only 40 out of 100 trades can earn plus 110% if its average win is 5% and its average loss is 1.5%. Win rate describes how often you are right, not how much money you make from being right.
How do traders artificially inflate their win rate, and what does it cost?
A high win rate is usually produced by one of three methods, each with a hidden cost. Moving the stop far and the target close pushes the win rate to 80% or higher, but rare stop-loss events eat the profit from dozens of wins. Removing the stop entirely pushes the win rate toward 100% while the loss just sits open, and averaging down keeps every series looking profitable while risk builds up until one bad day.
Why are losing streaks in a low win-rate strategy not a sign the edge is gone?
Losing streaks of five, six, or eight trades in a row are normal for a 40% win rate and mean nothing by themselves, since each trade does not remember the previous ones. An edge is a property of the distribution that pays off over many repetitions, not a reserve that gets used up. A casino with roughly a two percent edge in roulette does not change its rules after a lucky evening, since the edge shows up over volume.
What should investors look at instead of win rate?
It helps to look at the ratio of average win to average loss, since a value above two combined with a 40% win rate already produces a sustainable result. Expectancy per trade, win rate times average win minus loss rate times average loss, is one number accounting for both frequency and size. The maximum historical losing streak and the exit profile show what has to be tolerated and how the win rate was achieved.