Strategy capacity: how much capital can be deployed without killing returns

In this article, we’ll explore why strategy capacity matters as much as returns, how order book depth and liquidity limit the amount of capital a trading system can absorb, and what investors should ask before trusting a manager’s claims about scalable performance.
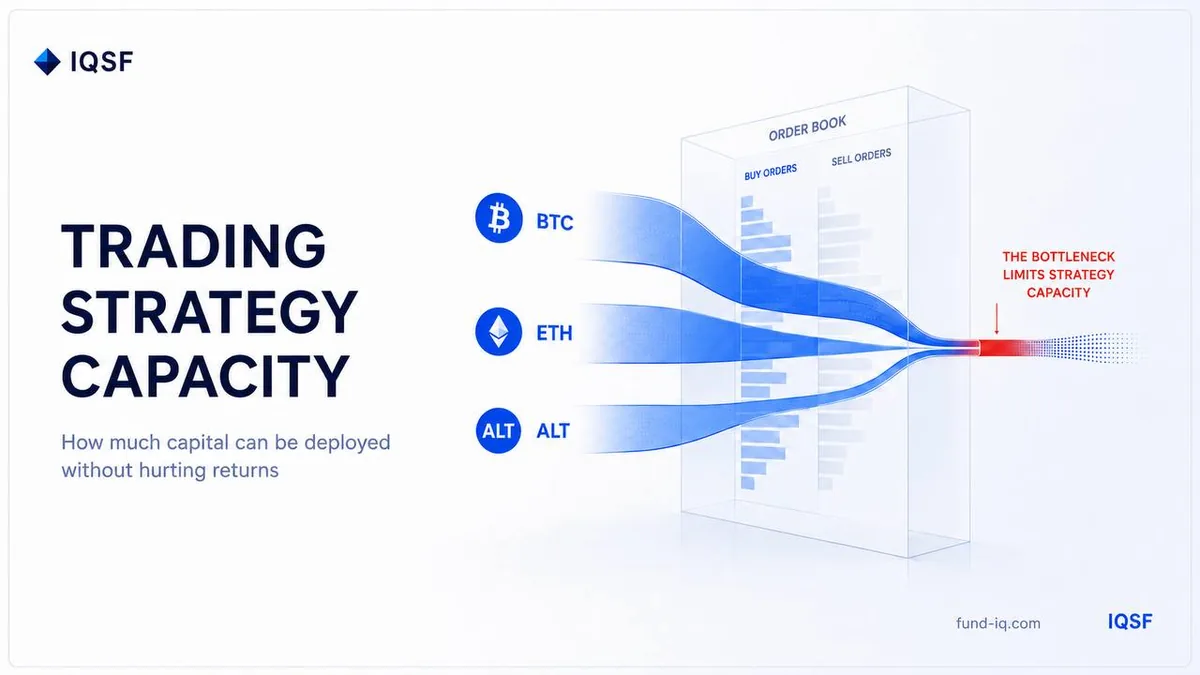
Strategy capacity is the maximum position size a strategy can hold in the market without moving the price against itself. The same system will produce different results on a $100,000 deposit and on a $10 million deposit. The difference does not come from the quality of management, but from order book depth: a large order consumes the very price level it was trying to trade.
Below, we explain how to calculate the maximum position size for each instrument, why daily turnover, not instant liquidity, is the correct base for limit-order strategies, and which single question can reveal an unrealistic promise from a manager in under a minute. At the end, there is a table with a calculation based on real figures for three instruments.
What strategy capacity is and why it is not the same as deposit size
Capacity is measured in position size, not in account size. This is essential. With 20x leverage, a $100,000 deposit holds a $2 million position, and the market only cares about the second number. The order book does not know how much of your own capital you deposited. It only sees the order.
This leads to the first conclusion: capacity cannot be discussed separately from the instrument. A strategy trading Bitcoin and the same strategy trading an illiquid altcoin can have capacities that differ by dozens of times, even with identical entry and exit rules.
The second conclusion: capacity is not a manager’s opinion. It is a measurable value. It can be calculated from public exchange data, and any investor can verify the calculation independently.
Why daily turnover is used as the base, not the volume of one bar
There is a common way to estimate capacity: take the trading volume over one minute or fifteen minutes and say that the order should not exceed a certain share of that volume. For a strategy that uses market orders, this makes sense. It enters here and now, and what matters is how much liquidity is available in the order book at the moment the button is pressed.
But most algorithmic strategies work with limit orders. The level is placed in advance and remains in the order book for hours, gradually filling as the market approaches it. Such an order does not sweep the order book in one shot. It accumulates.
That is why the correct base for limit-order strategies is the daily turnover of the instrument. A commonly used conservative threshold is one percent of daily trading volume. This is an empirical figure, but it is widely used in the industry as a level below which price impact is considered negligible.
The calculation is done in three steps:
- Take the median turnover of a 15-minute bar over the last 30 days. Median, not average: one volume spike on news should not inflate the estimate.
- Multiply it by 96, the number of 15-minute bars in a day. This gives daily turnover.
- Take one percent of that number. This is the maximum position size for the instrument.
Calculation using real figures
Below are data for three instruments on one cryptocurrency exchange, taken over a 30-day window.
| Instrument | Median bar turnover | Daily turnover | Maximum position size |
|---|---|---|---|
| BTC | $6,522,763 | $626,185,234 | $6,261,852 |
| ETH | $3,375,666 | $324,063,891 | $3,240,639 |
| Medium-liquidity altcoin | $245,344 | $23,553,053 | $235,531 |
The difference between the first and third rows is almost thirtyfold. A strategy that shows attractive returns on an altcoin physically cannot repeat those returns on the kind of size that Bitcoin can absorb easily.
It is also important to note that these figures differ from one exchange to another. For the same Bitcoin instrument, the order book of a major venue can be three times deeper than the order book of a smaller venue. That is why capacity is always calculated for the exchange where the strategy is actually executed, not for the most liquid exchange in existence.
How capacity is connected to deposit size
Position size is connected to deposit size through actual leverage, meaning the ratio between the open position and capital at the peak moment. For grid strategies with additional entries, this value is taken from history: the maximum position size held relative to the account.
The conversion formula is simple:
Maximum deposit = maximum order book capacity / (account allocation to this instrument x peak position-to-capital ratio)
Example. An instrument has a maximum position size of $235,531. The strategy allocates 20% of the account to this instrument, and the peak position reached 16 times the capital of that leg. Then the maximum deposit is:
$235,531 / (0.2 x 16) = approximately $73,600
The number may look modest compared with the stated return, and that is normal. Return and capacity are inversely related. The narrower and more volatile the instrument, the higher the potential return, and the lower the size at which that return can be repeated.
Why portfolio capacity is determined by the thinnest instrument
When a strategy trades several instruments, it is tempting to add their capacities together. This is a mistake.
Order books of different instruments do not combine. A Bitcoin order does not compete with an altcoin order. These are different books. But capital is distributed between them according to predefined weights, and the portfolio hits its limit at the instrument that reaches its own order book capacity first.
Using the figures from the table above, with weights of 40 / 40 / 20, the picture looks like this:
| Instrument | Position size at maximum deposit | Order book capacity | Capacity used |
|---|---|---|---|
| BTC | $274,582 | $6,261,852 | 4.4% |
| ETH | $324,167 | $3,240,639 | 10.0% |
| Altcoin | $235,531 | $235,531 | 100% |
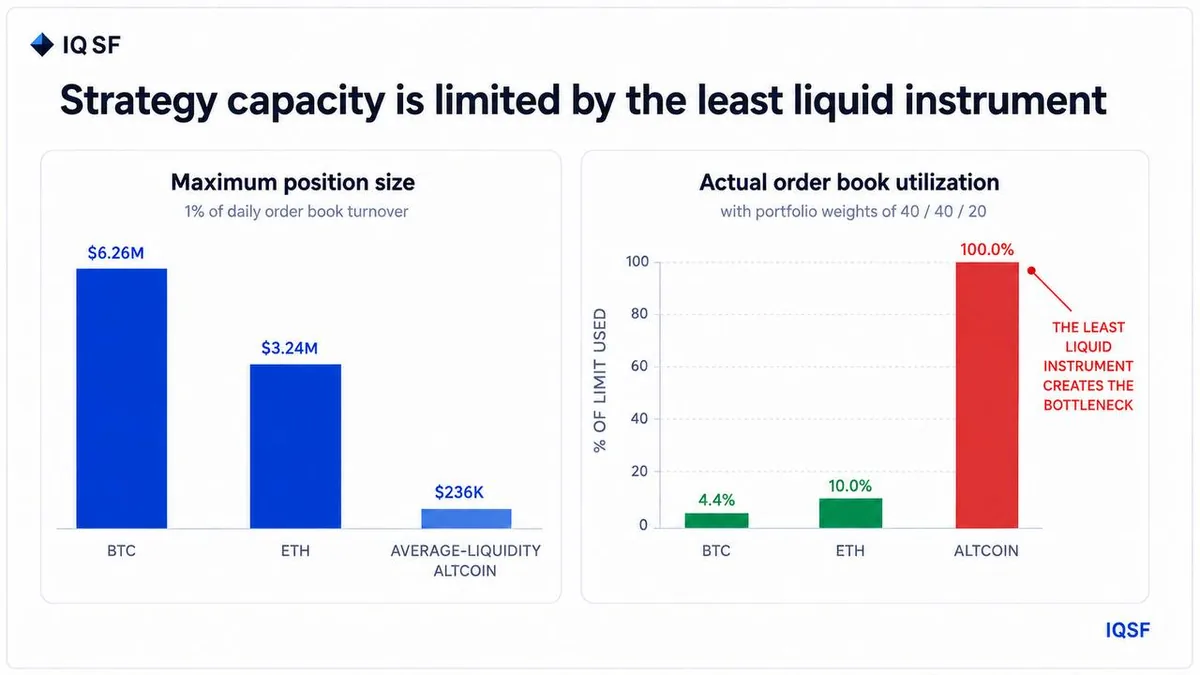
Chart 1. Order book capacity for each instrument and actual portfolio load
The portfolio hits the limit in the third row, while the first two instruments are only using a few percent of their available capacity. The total portfolio capacity is around $834,000 in position size with a deposit of roughly $74,000, even though two out of three instruments could absorb much more.
The practical conclusion from this table is simple: if there is a thin instrument in the portfolio, it compresses the capacity of the entire structure. There are two ways to expand it. The first is to reduce the weight of the thin instrument, exchanging part of the return potential for more capacity. The second is to move the liquid instruments to a separate account, where their full capacity can be used independently.
What happens when capacity is exceeded
Exceeding capacity does not look like an accident. It looks like a slow deterioration that is easy to blame on the market.
First, slippage increases. The order is executed worse than the calculated price, and the difference accumulates on every trade. For a strategy with a take-profit of half a percent, an extra 0.2% of slippage can consume almost half of the profit per trade.
Second, some orders stop filling completely. The position is not built in full, real performance starts to diverge from the model, and the divergence becomes strongest exactly when the move is powerful, which is when the strategy is supposed to earn the most.
Third, the strategy’s own order starts moving the price. This is especially visible on exits: selling a large position pushes down the price at which you sell, meaning you begin to compete with yourself.
None of these three effects creates an instant failure. Together, they simply make returns lower than promised, and they can be explained away by almost anything, from a change in market regime to temporary market conditions.
How to check a manager’s capacity in one minute
The question is simple:
At what assets under management does your strategy stop producing the stated result, and how did you calculate it?
A good answer contains three things: a specific amount, a calculation method, and a clarification by instrument. For example: up to this amount, calculated as a share of daily turnover for each instrument, with this instrument being the bottleneck.
A bad answer usually comes in two forms. The first: there are no limits, we can take any amount. This is either a misunderstanding of the strategy’s own mechanics, or the strategy trades instruments so liquid that this should be stated directly. The second: vague wording about the question being complex and depending on many factors.
A separate red flag is unlimited capacity claimed on an illiquid instrument. These two statements cannot both be true, and they can be checked in five minutes using public exchange data.
What investors need to understand
Capacity is not about whether your money will be accepted. It almost always will be. Capacity is about whether the result on that money will be the same as the result shown in tests and on smaller amounts.
There is one pattern worth keeping in mind: the higher the historical return of a strategy, the more likely it is to have low capacity. High returns are often generated in highly volatile instruments, and high volatility is more often found in thin order books. This is not always the case, but it happens often enough to ask the question.
Finally, capacity changes together with the market. An instrument that can absorb $1 million today may absorb three times less in six months if interest in it declines. A calculation made a year ago is not current capacity. It is a historical fact.
Frequently asked questions
What is strategy capacity, and how is it different from deposit size?
Strategy capacity is the maximum position size a strategy can hold without moving the price against itself, measured in position size, not account size. Leverage lets a modest deposit control a much larger position, and the order book only sees that larger number. Capacity also depends on the instrument traded, since a liquid asset and a thin one support very different position sizes under identical rules.
How is a strategy's maximum position size for an instrument calculated?
Limit order strategies base capacity on daily turnover, not the volume of a single bar, because a resting order fills gradually over hours instead of sweeping the book at once. The method takes the median 15 minute turnover over 30 days, multiplies by 96 for daily turnover, and treats about one percent of that as the maximum position size. A liquid instrument like bitcoin can support almost thirty times more than a thin altcoin.
Why is a portfolio's total capacity set by its least liquid instrument rather than the sum of all instruments?
Order books for different instruments do not combine, so a bitcoin order never competes with an altcoin order, but capital is split between them by fixed weights. The whole portfolio hits its limit as soon as the thinnest instrument reaches its own capacity, even while more liquid instruments use only a fraction of theirs. Reducing the thin instrument's weight or moving liquid instruments to a separate account raises that limit.
What happens to a trading strategy's results when its capacity is exceeded?
Exceeding capacity looks like slow deterioration rather than a sudden failure, and is easy to blame on the market. Slippage rises as orders fill at worse prices, some orders stop filling completely so real results diverge from the model, and the strategy's own orders start moving the price against it, especially on exits. None of these effects alone is dramatic, but together they quietly make returns lower than promised.