Why a strategy does not make money every month and why a smooth chart is a warning sign
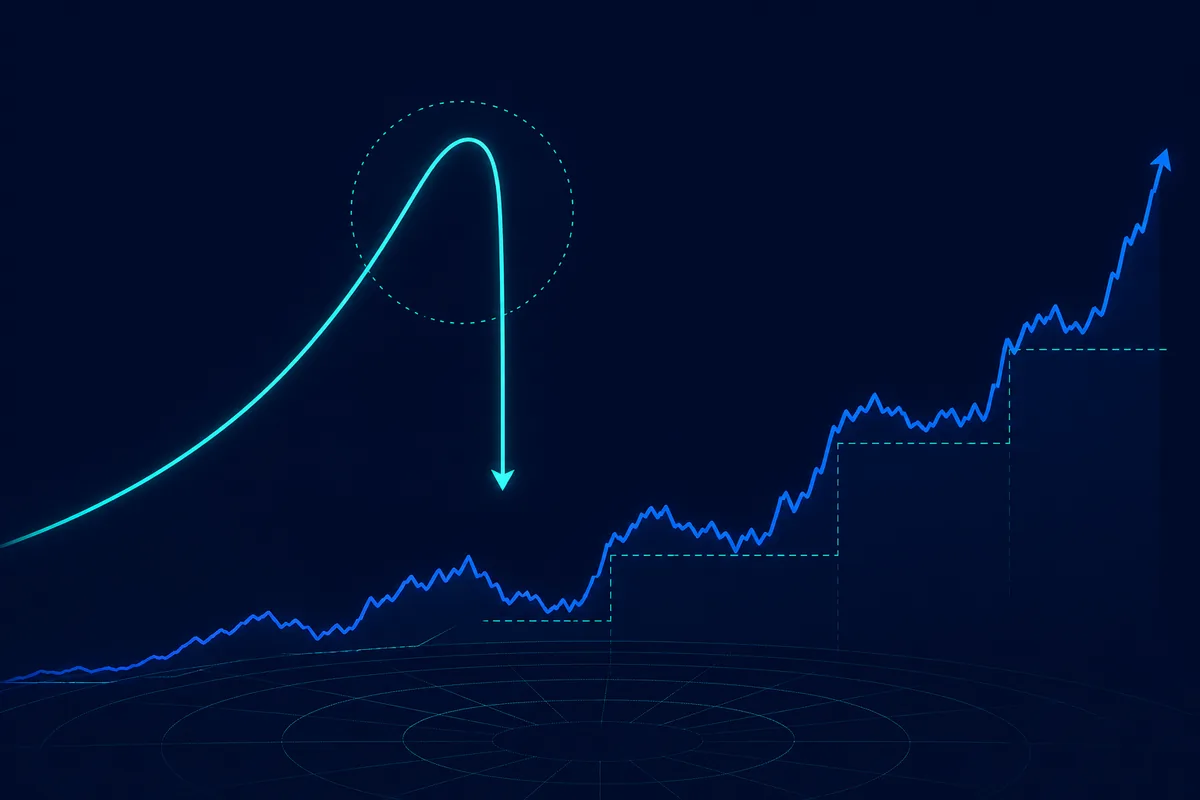
In this article, we’ll explore why even a strong trading strategy does not have to make money every month, why a perfectly smooth equity curve can be a warning sign, and how investors can assess performance by market regimes instead of average monthly returns.
Profit in the market comes from price movement, and price movement does not happen all the time. For a significant part of the time, the market moves sideways in a range, where a good strategy earns little or earns nothing at all. That is why a steady monthly profit is not a sign of quality, but a reason to ask where the return comes from when there is no movement.
Imagine a surfer who promises you the same result every day. Regardless of whether there are waves or the sea is as smooth as glass.
You would immediately feel that something is wrong. A surfer does not create the wave — he catches it. In calm water, his skill does not disappear. There is simply nothing to apply it to.
A market strategy works in exactly the same way, but for some reason, a smooth chart often creates admiration rather than suspicion.
Where strategy profits come from: return structure
Returns come from movement. From a trend, from momentum, from expanding volatility, from moments when price decides to move far in one direction.
The market is not always in this state. A significant part of the time, it moves inside a range, where the movement is not strong enough to cover the costs of entering and exiting positions. During such periods, a good strategy earns little or earns nothing at all.
This is not a malfunction. It is the absence of a wave.
It is useful to understand the return structure of trend-following approaches. Most of the result comes from a small number of trades. A typical picture looks like this: out of one hundred trades, about five generate more than half of the final profit, another thirty produce a small gain, and the remaining sixty-five stay around zero or slightly negative.
This means that a month without a large move is mathematically supposed to be boring. It simply did not contain one of those five trades.
Three market regimes: trend, range, volatility spike
There are usually three market regimes, and a strategy behaves differently in each of them.
Trend. Price moves in one direction for longer than usual. Trend-following and momentum strategies generate most of their annual result precisely in this regime. Such periods do not happen often during the year — sometimes only two or three times.
Range. Price moves inside a corridor, and every move is quickly reversed. Trend-following approaches lose a little here on false signals. This is the price paid for being ready to catch the next trend.
Volatility spike. Sharp moves without a clear direction, often driven by news. Here, everything depends on the strategy design: some strategies earn the most in this regime, while others experience their worst days in history.
A good manager can explain in which regime their strategy earns money, in which regime it stays flat, and in which regime it loses. If the answer sounds like “it earns in all conditions,” that is not strength. It is either a lack of understanding of the model or an unwillingness to discuss it.
Why a smooth positive return is a warning sign
If the result is equally positive in every market regime, then the return does not come from price movement. It comes from somewhere else, and there are only a few options.
The first option is selling insurance against a rare event. The premium comes in steadily and predictably until the event happens. Then, in one day, everything accumulated is lost — and more. This kind of curve looks like a staircase moving upward in small, even steps, and then suddenly breaking vertically downward.
The second option is hidden position buildup against the move. The loss exists, but it has not been realized, so it does not appear in the report. The position keeps growing, while the report shows a smooth profit from small closed trades. The chart stays smooth exactly until there is nothing left to average with.
The third option is that the result is simply fabricated. The report is a picture, there is no account access, and nothing can be verified.
All three options produce the same beautiful picture during the first months. And all three end the same way.
A well-known historical illustration of the first type is Bernard Madoff’s fund, which showed stable positive returns of around one percent per month for years, with almost no losing periods. This unnatural smoothness was the main warning signal for the few analysts who were asking questions long before the collapse. The market does not behave like that, and a strategy that behaves differently from the market has to explain where the return comes from.
What a healthy chart looks like
An honest strategy has visible periods of inactivity. Months around zero, sometimes a small loss, and then a sharp move upward when the market finally provides the wave.
Such a chart is less pleasant to look at than a smooth rising line. But it shows that the strategy is connected to reality, not to a fantasy about it.
You should not check for consistency alone. You should check behavior in different regimes: what happened during a strong trend, what happened during a long sideways market, and what happened during panic. Three answers instead of one beautiful line.
What questions to ask instead of asking about monthly returns
The question about monthly return sets the wrong frame by itself. It assumes that the market is supposed to pay regularly, like a tenant.
More useful questions sound different.
How many of the last twenty-four months were losing months, and which one was the worst. This immediately shows the real dispersion of results.
What was the longest period without a new high in the equity curve. This is the same time underwater.
In which market regime does the strategy make money, and what happens when that regime does not appear for several months in a row.
The answers to these three questions give an understanding of the product. An answer about average monthly return gives almost nothing, because the average of an uneven series hides exactly what you were trying to understand.
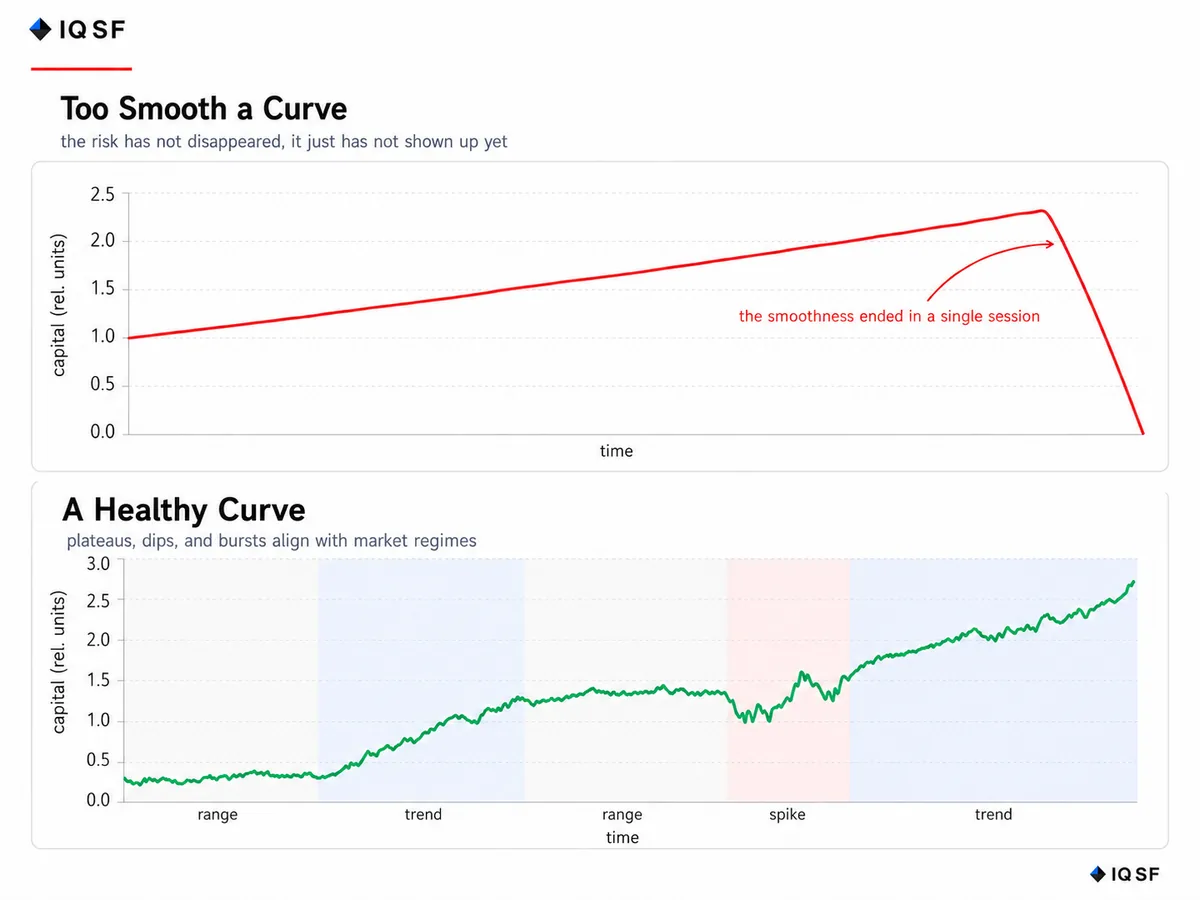
Chart 1. At the top: a smooth curve that broke in a single session. At the bottom: a healthy curve with plateaus and bursts.
Frequently asked questions
Why doesn't a good trading strategy make money every month?
A strategy makes money from price movement, and the market spends a significant part of its time inside a range where a good strategy earns little or nothing. In a typical trend-following strategy, out of one hundred trades about five generate more than half of the total profit, another thirty add a small gain, and the remaining sixty-five stay near zero or slightly negative. A quiet month simply means none of those few big trades happened yet.
Why is a perfectly smooth, steadily rising equity curve considered a warning sign?
A curve that is positive in every market regime is not being driven by price movement, so the return has to come from somewhere else. It could be a strategy selling insurance against a rare event, collecting a steady premium until that event wipes out everything gained, or a hidden losing position that stays unrealized. Bernard Madoff's fund, showing about one percent per month for years with almost no losing periods, is a well-known example.
What are the three market regimes that affect a strategy's returns?
The three regimes are trend, where price moves in one direction longer than usual and generates most of a strategy's annual result, happening only two or three times a year; range, where trend-following approaches lose a little on false signals; and volatility spikes, sharp undirected moves, where results depend on the strategy's design. A manager who can explain which regime earns, which is flat, and which loses understands the model.
What questions reveal more about a strategy than its average monthly return?
More revealing questions include how many of the last twenty-four months were losing and which was worst, how long the longest period was without a new equity high, and in which market regime the strategy actually earns money. An average monthly return hides exactly what these questions reveal, since averaging an uneven series smooths over the very unevenness that matters. The answers show whether a strategy is tied to real market movement.