Investment return: how to calculate annual and average return

In this article, we’ll explore how to calculate annual and compound annual growth rates (CAGR), why simple averages can be misleading, how deposits, fees, and inflation affect investment returns, and why evaluating performance alongside risk is essential for making informed investment decisions.
Investment return is the gain on an investment as a percentage of the money put in: ending value plus income received, minus the amount invested, divided by the amount invested. Annual return expresses that result over one year, and average annual return, or CAGR, is the constant yearly growth rate that would turn the starting amount into the final one over several years.
How to calculate investment return
Simple return shows how much the invested money grew over the whole holding period, and it is calculated from the money that actually reached the investor.
A hypothetical example: shares bought for $10,000 are sold two years later for $11,200, and $600 in dividends came in along the way. Return = (11,200 + 600 - 10,000) / 10,000 = 18% over two years. Taxes and trading costs reduce the result, so use the amounts that actually stayed with you.
Simple return has one weakness: it ignores time. 18% over two years and 18% over six years are very different results, so to compare investments the result is converted to a yearly figure.
How to calculate annual return
Annual return is the result restated for a one-year period: (1 + return for the period)^(365 / days held) - 1.
For the example above: 1.18^(1/2) - 1 = 8.6% a year, not 18 / 2 = 9%. The difference appears because the first year's gain earns its own return in the second year. "Annual return" can also mean the result of a single calendar year, which is fine as long as it is labelled that way.
US banks use the same formula by law. Regulation DD, which implements the Truth in Savings Act, defines the annual percentage yield as APY = 100 × [(1 + interest / principal)^(365 / days in term) - 1]. That is why a 5% rate compounded monthly is advertised as an APY of 5.12%: (1 + 0.05 / 12)^12 - 1 = 5.12%.
A short period converted to a year produces misleading numbers. A lucky +10% in one quarter becomes 1.1^4 - 1 = 46.4% annualized, although nothing promises that the next three quarters will repeat it. A fair rule: annualize only periods of a year or longer, or label the number "annualized".
What is average annual return (CAGR)?
Average annual return, or compound annual growth rate (CAGR), is the constant yearly rate that would take capital from its starting value to its ending value: (ending value / starting value)^(1 / years) - 1.
If capital doubles in seven years, CAGR is 2^(1/7) - 1 = 10.4%, not 100 / 7 = 14.3%. In Excel, the RRI function does the same job: =RRI(7, 100000, 200000) returns 10.4%.
Let us check the formula on our own data. On the IQSF strategy dashboard, as of October 4, 2026, the Basket 50 strategy shows a total return of 7086.43% since August 1, 2019: the capital grew 71.86 times over 2,621 days, or 7.176 years (the dashboard counts a year as 365.25 days to allow for leap years). 71.86^(1/7.176) - 1 = 81.43%, which is exactly the CAGR on the dashboard. The same dashboard shows the risks next to it: a maximum drawdown of -28.59% and a longest drawdown period of 241 days, a drawdown still open on the cut-off date, while 2026 stood at -4.38% as of October 4. Past performance does not guarantee future results.
Annual returns multiply rather than add: (1 + 0.5037) × (1 + 0.658) × ... × (1 - 0.0438) over the eight calendar years on the dashboard (2019 and 2026 are partial) gives the same 71.86 times. Each year's percentage applies to an amount that has already grown or shrunk.
Why the arithmetic average of returns is misleading
The arithmetic average of yearly returns overstates performance, because a percentage gain and a percentage loss are taken from different amounts.
The shortest example: +50% in year one and -50% in year two. The arithmetic average is zero, yet the capital fell by 25%: $100 became $150 and then $75. The CAGR here is -13.4%. Why a 50% loss needs a 100% gain to recover is covered in How to calculate recovery after a drawdown.
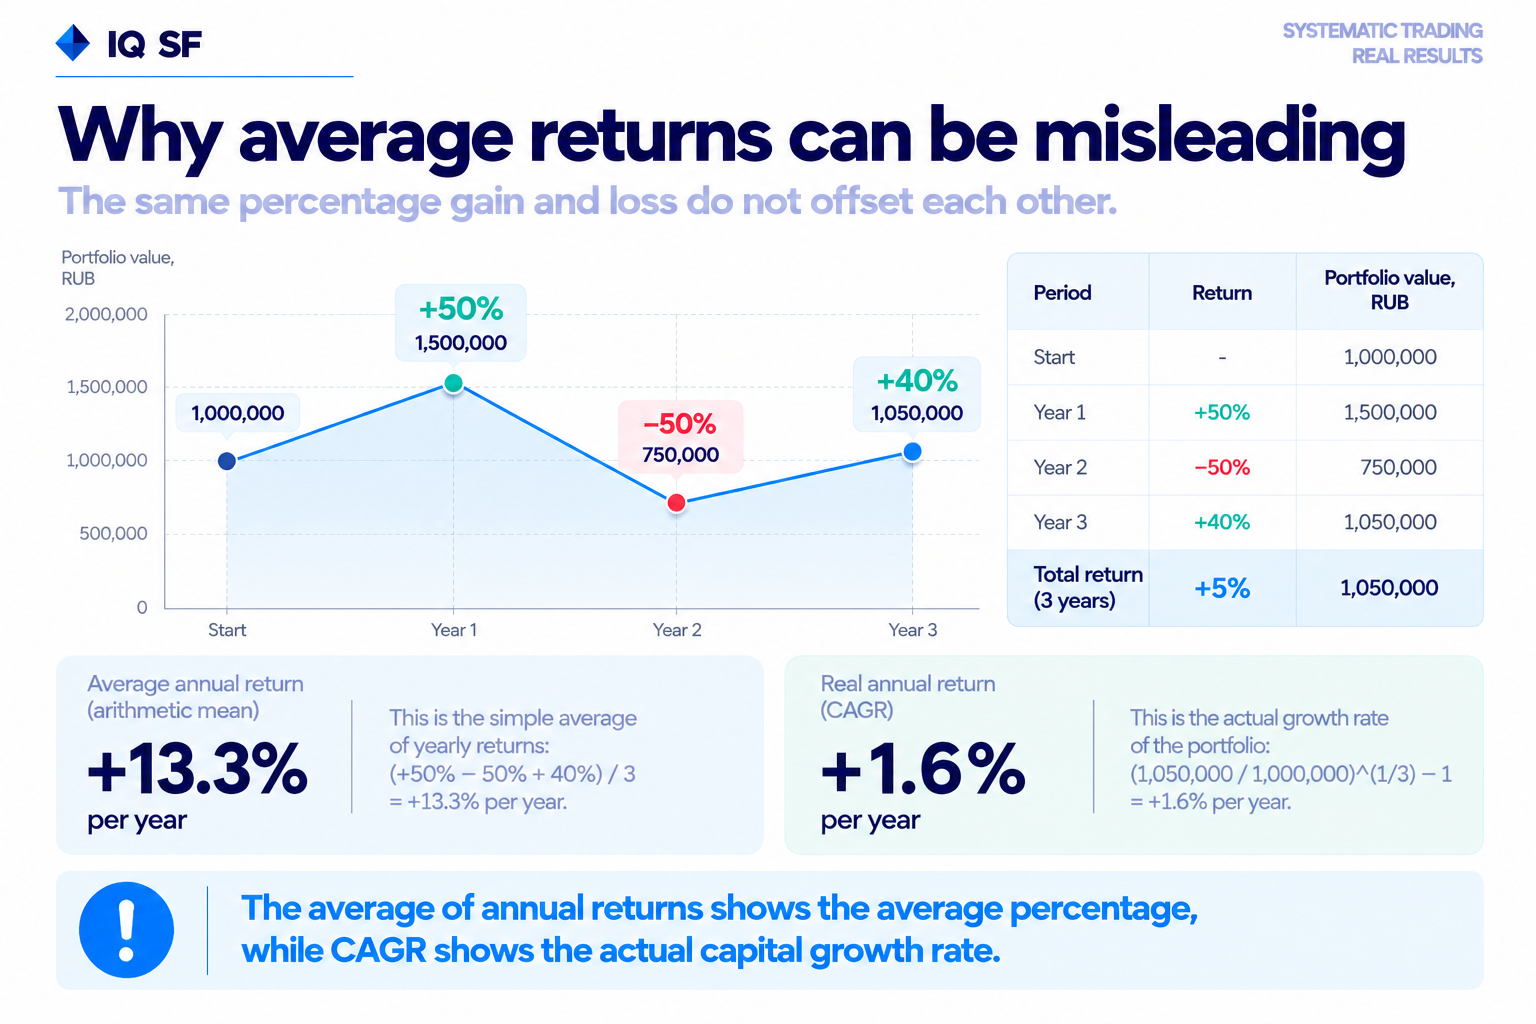
A three-year example:
Year | Return for the year | Capital at year end |
Start | $100,000 | |
Year 1 | +50% | $150,000 |
Year 2 | -50% | $75,000 |
Year 3 | +40% | $105,000 |
Three-year result | arithmetic average +13.3% a year | +5% in total, CAGR +1.6% a year |
The phrase "13% a year on average" is technically true here, while the investor made 5% in three years. The more returns swing from year to year, the wider the gap between the arithmetic average and CAGR, so multi-year results are judged by CAGR.
Time-weighted vs money-weighted return
When an investor adds or withdraws money, the same strategy produces two returns: the time-weighted return measures the strategy, and the money-weighted return measures the investor's own result.
Suppose a strategy gains 20% in year one and loses 10% in year two. Its time-weighted return is 1.2 × 0.9 - 1 = 8% over two years, or 3.9% a year. Investor A puts in $10,000 at the start and ends with $10,800. Investor B also starts with $10,000 but adds $20,000 after the good year: $32,000 × 0.9 = $28,800 against $30,000 invested. The strategy made money, yet investor B lost $1,200, a money-weighted return of -3.0% a year.
Managers are expected to report time-weighted returns: the Global Investment Performance Standards (GIPS) require them unless the manager controls client cash flows in a closed-end, fixed-life or similar fund. Investors measure their own result with Excel's XIRR function, using the dates and amounts of every deposit and withdrawal. Why these two numbers drift apart for real people is explained in Why investors earn less than the strategy.
Real return: adjusting for inflation
Real return shows how much purchasing power grew: (1 + return) / (1 + inflation) - 1.
According to the US Bureau of Labor Statistics, consumer prices rose 3.4% in the 12 months to August 2026. If inflation stays at that level for the year, an investment that earns 8% delivers a real return of 1.08 / 1.034 - 1 = 4.4%. Simple subtraction, 8 - 3.4 = 4.6%, slightly overstates it, and the error grows with higher rates and inflation.
Comparing a savings account with a strategy on a single return number does not work. A savings rate is known in advance, while a strategy's return changes from year to year and goes through drawdowns, so their depth and length over the whole period belong next to any return figure.
This material is for information only and is not individual investment advice.
Frequently asked questions
How do you calculate annual return on an investment?
Divide the ending value plus any income by the amount invested, raise the result to the power of 365 divided by the number of days held, and subtract one. For example, an 18% gain over two years equals 1.18^(1/2) - 1 = 8.6% a year. Periods shorter than a year are better left unannualized, because one lucky month turns into an unrealistic yearly figure.
What is the difference between annual return and average annual return?
Annual return describes a single year or a result restated for one year. Average annual return, usually CAGR, smooths several years while accounting for the fact that each year's percentage applies to an amount that has already grown or shrunk. For periods longer than a year, CAGR is the fair basis for comparing investments.
Is CAGR the same as average annual return?
Not always. "Average annual return" sometimes means the simple arithmetic average of yearly returns, which overstates results when returns swing: +50% and -50% average zero while the capital falls 25%. CAGR is the geometric average, and by construction it matches the actual starting and ending values.
How do you calculate CAGR in Excel?
Use =RRI(years, starting value, ending value): for example, =RRI(5, 100000, 150000) returns 8.4%. The formula =(150000/100000)^(1/5)-1 gives the same result. If money was added or withdrawn along the way, use XIRR with columns of dates and amounts.